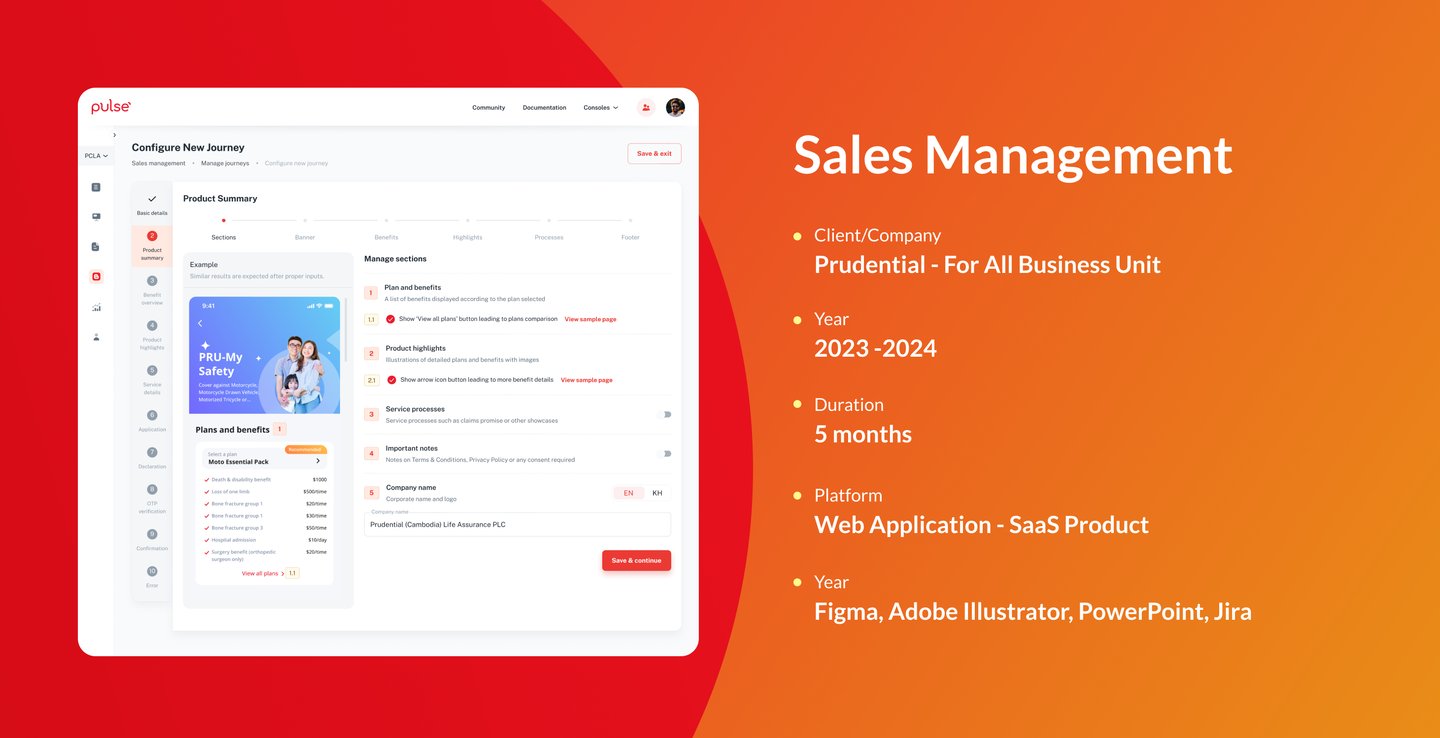
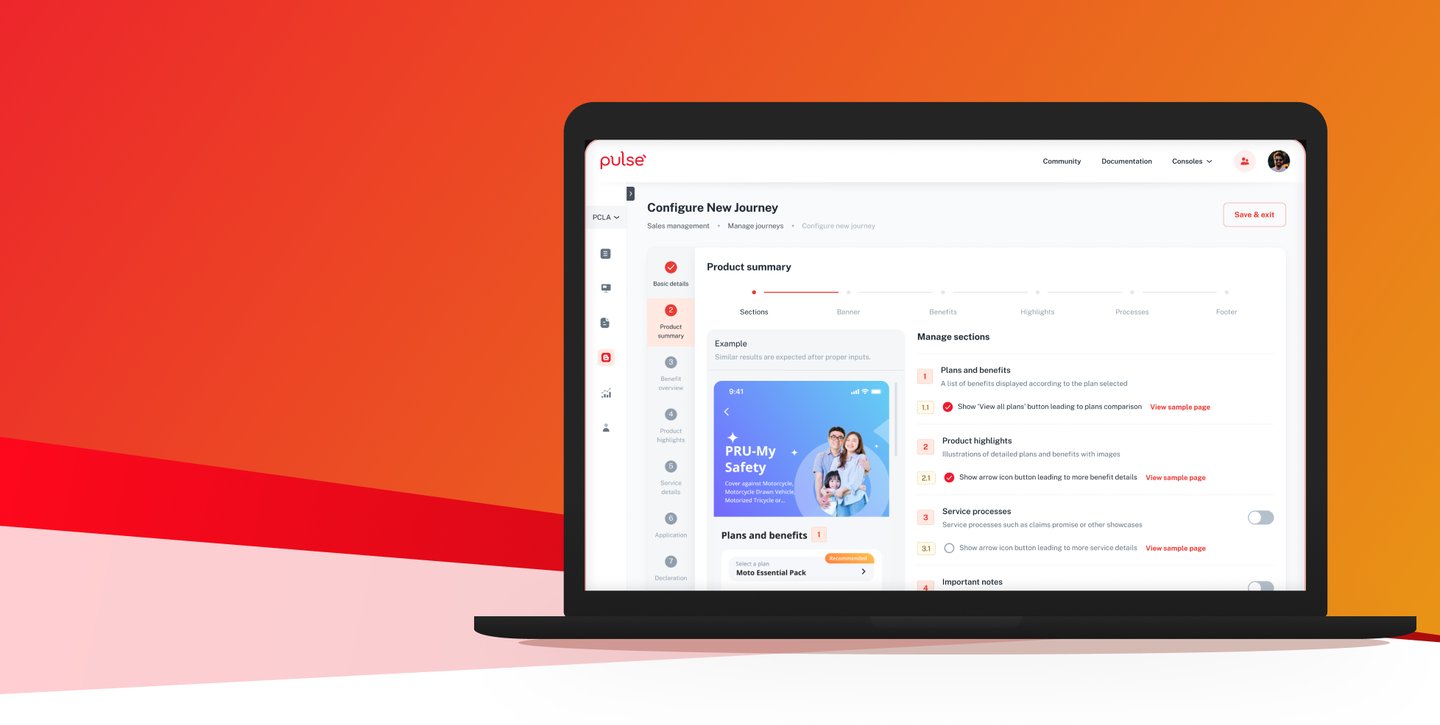
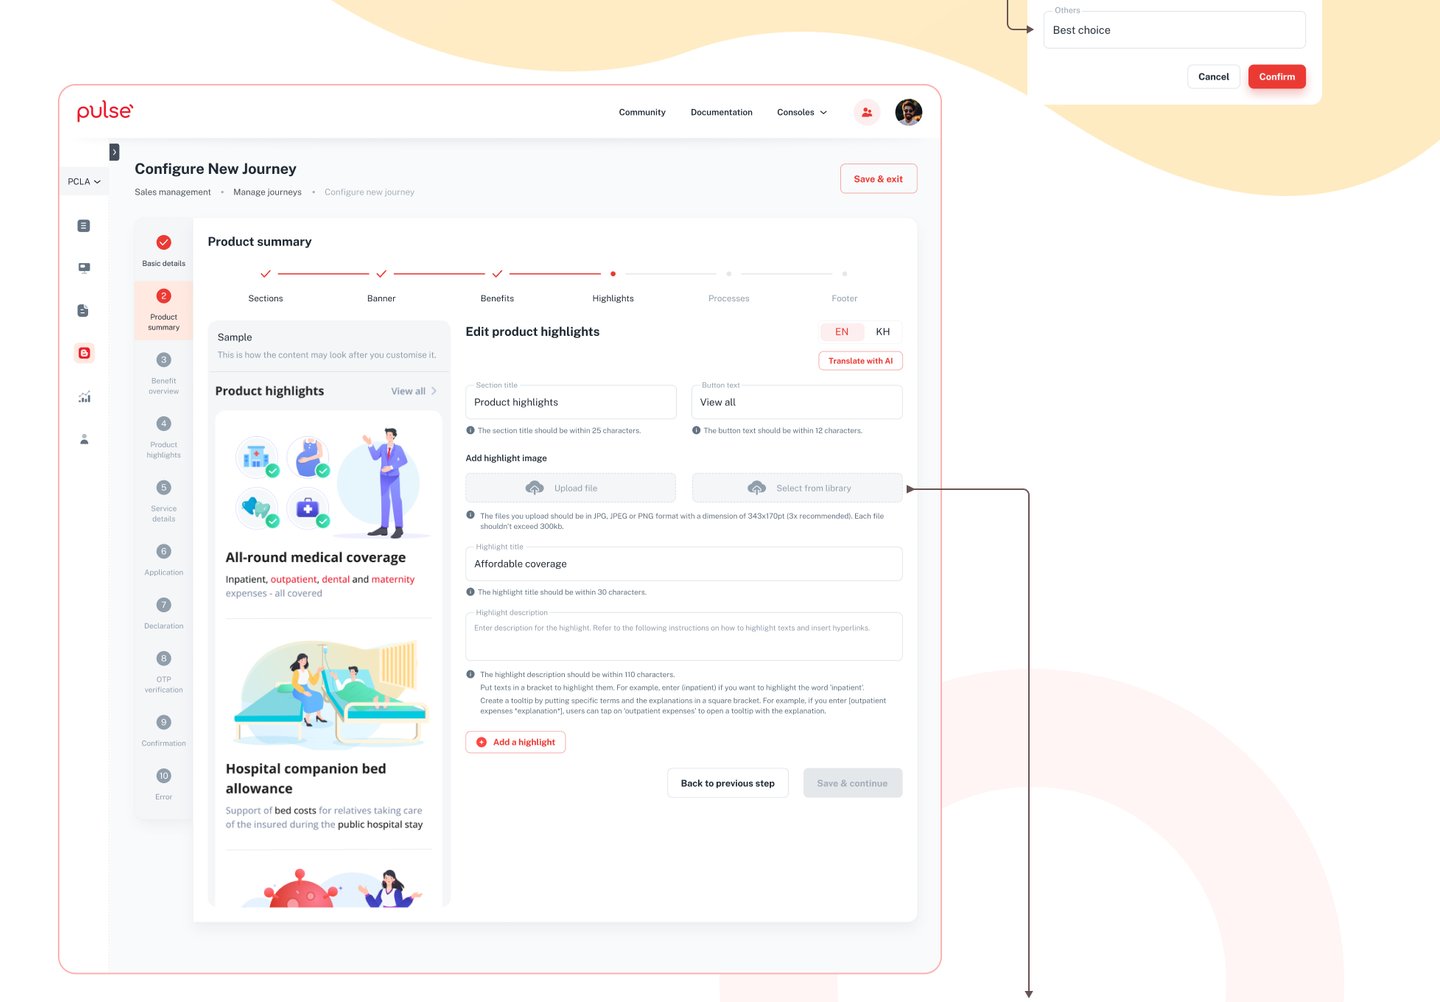
Prudential Sales Management (SaaS)
Insurance Product Configuration
Overview
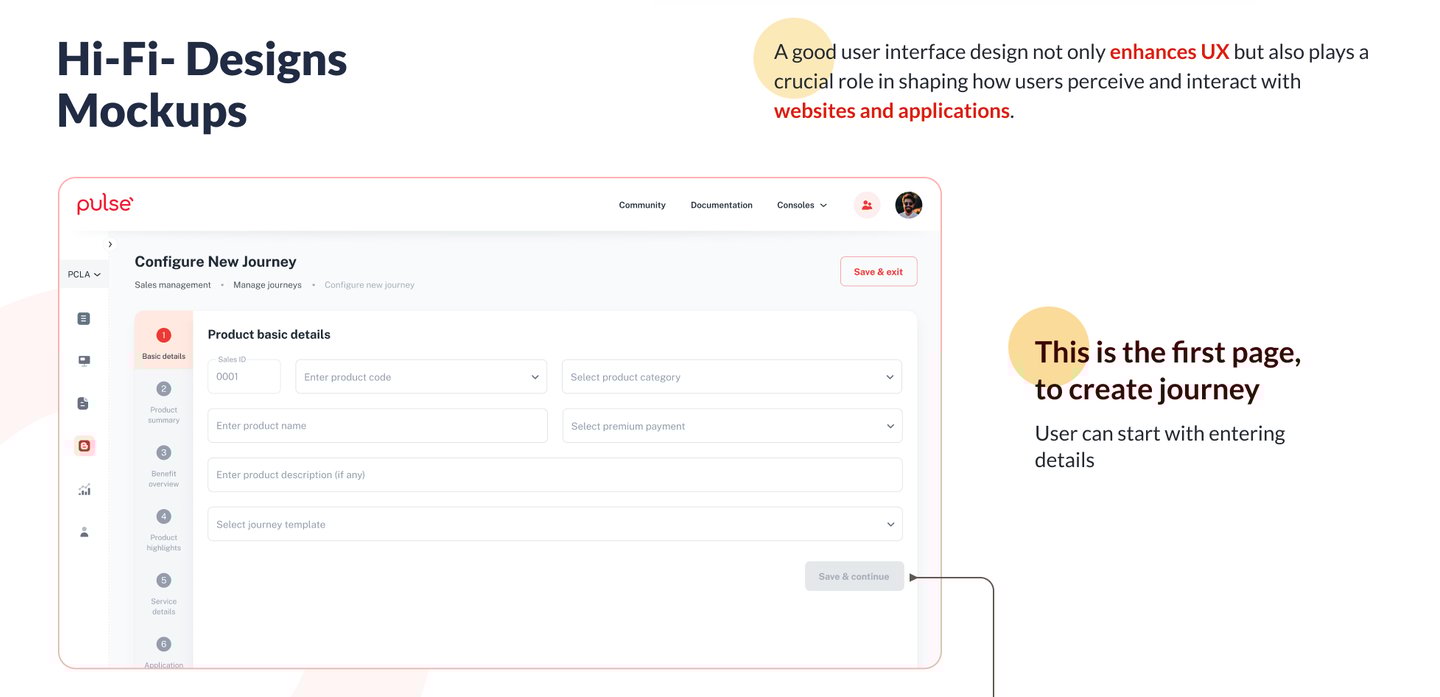
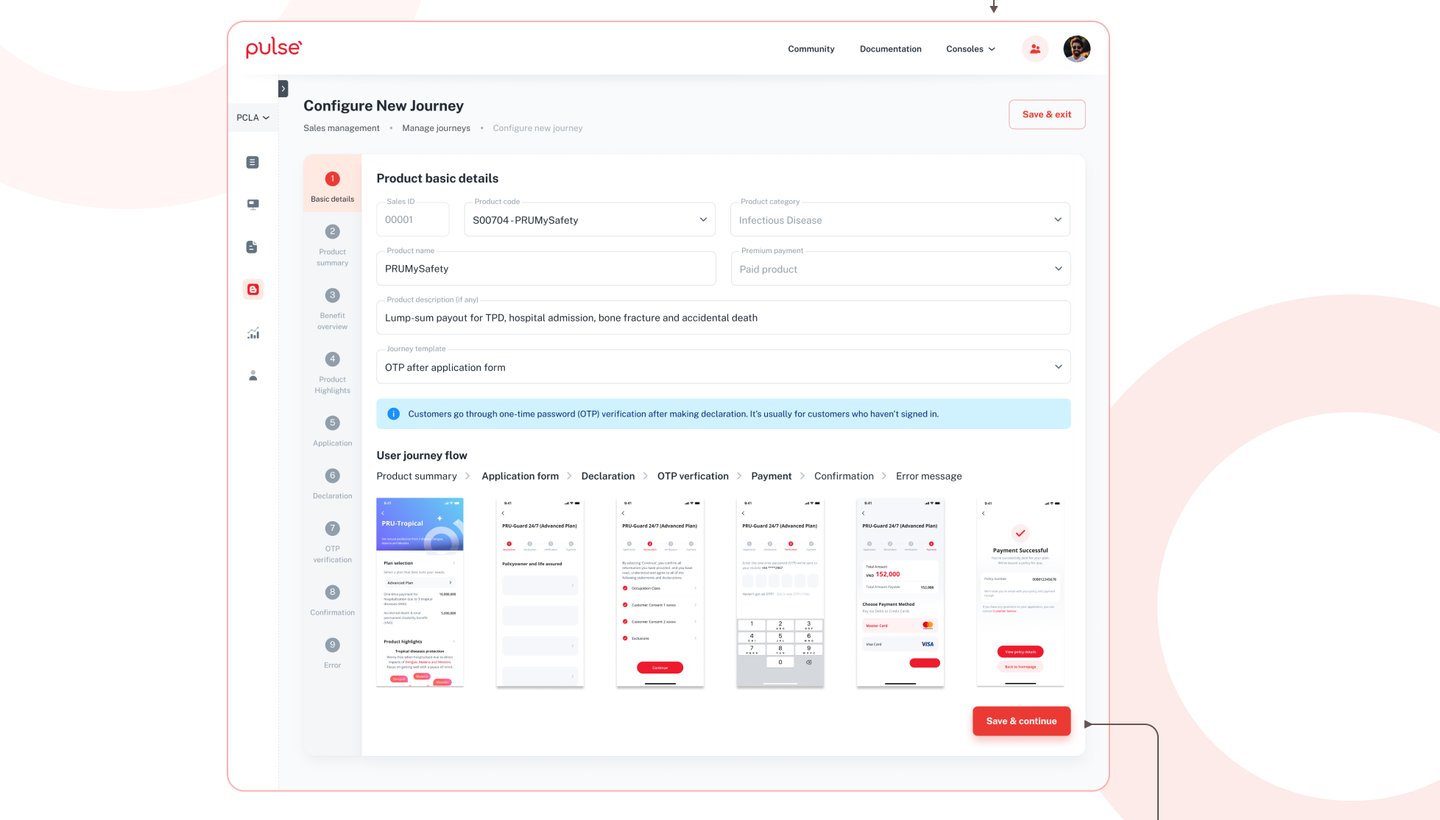
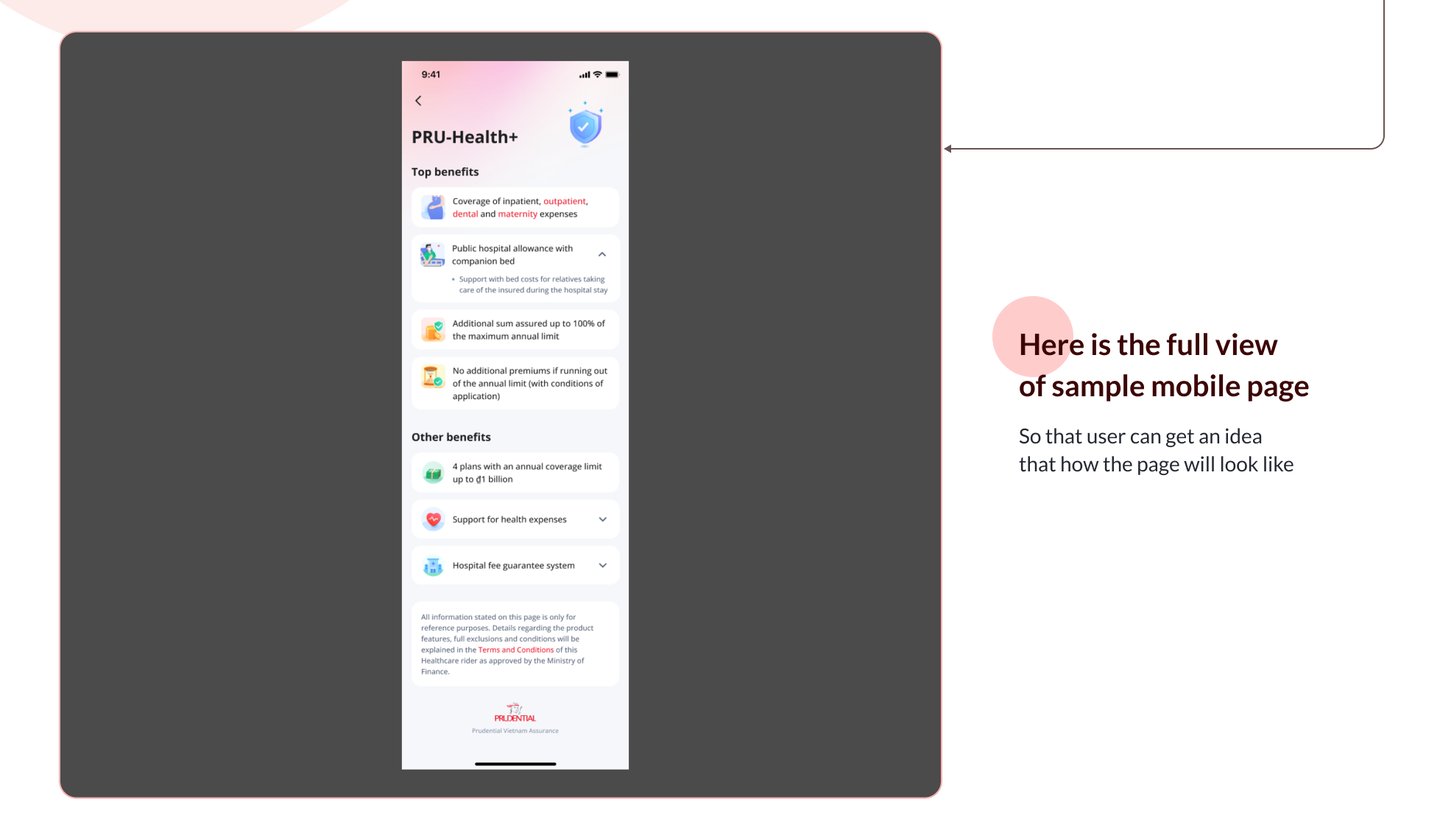
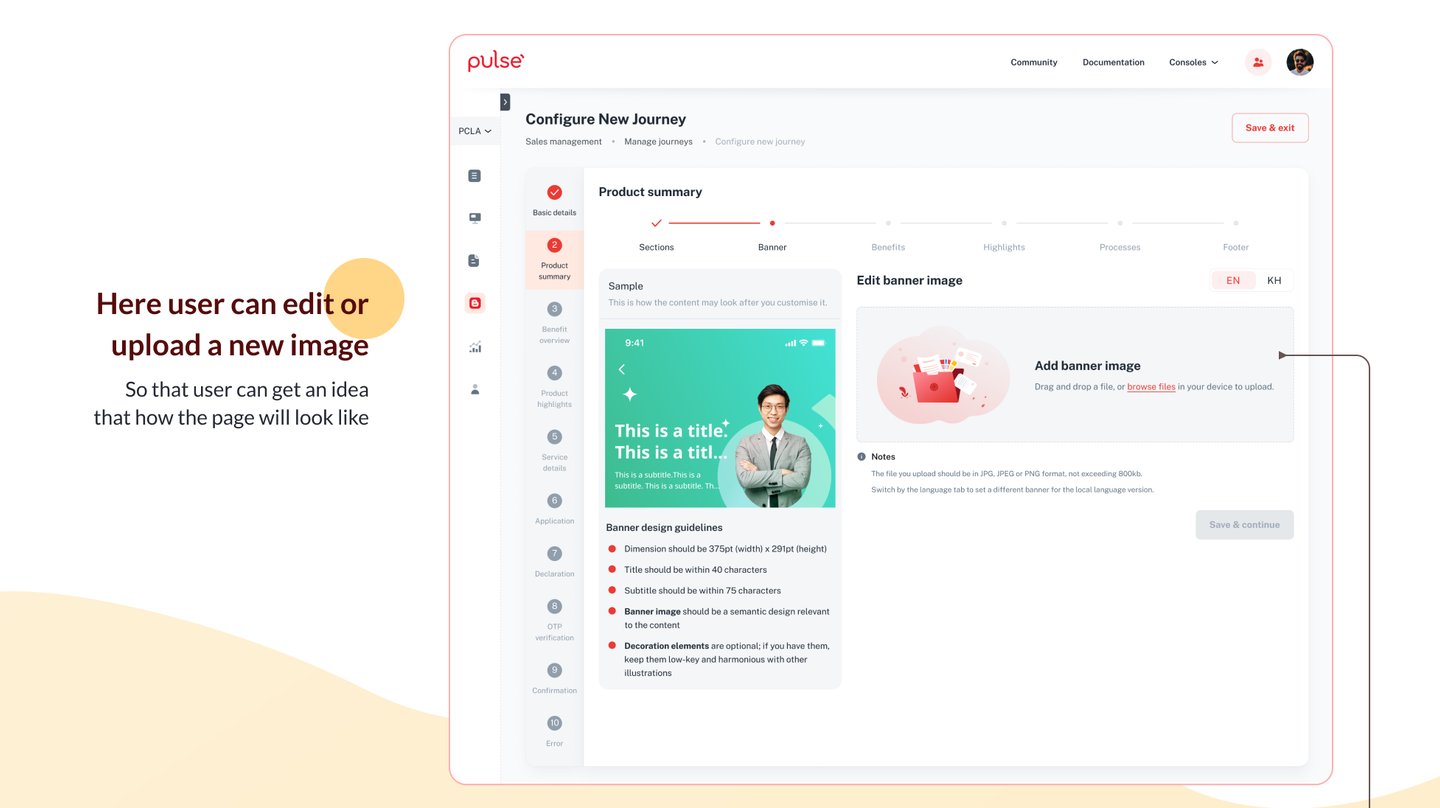
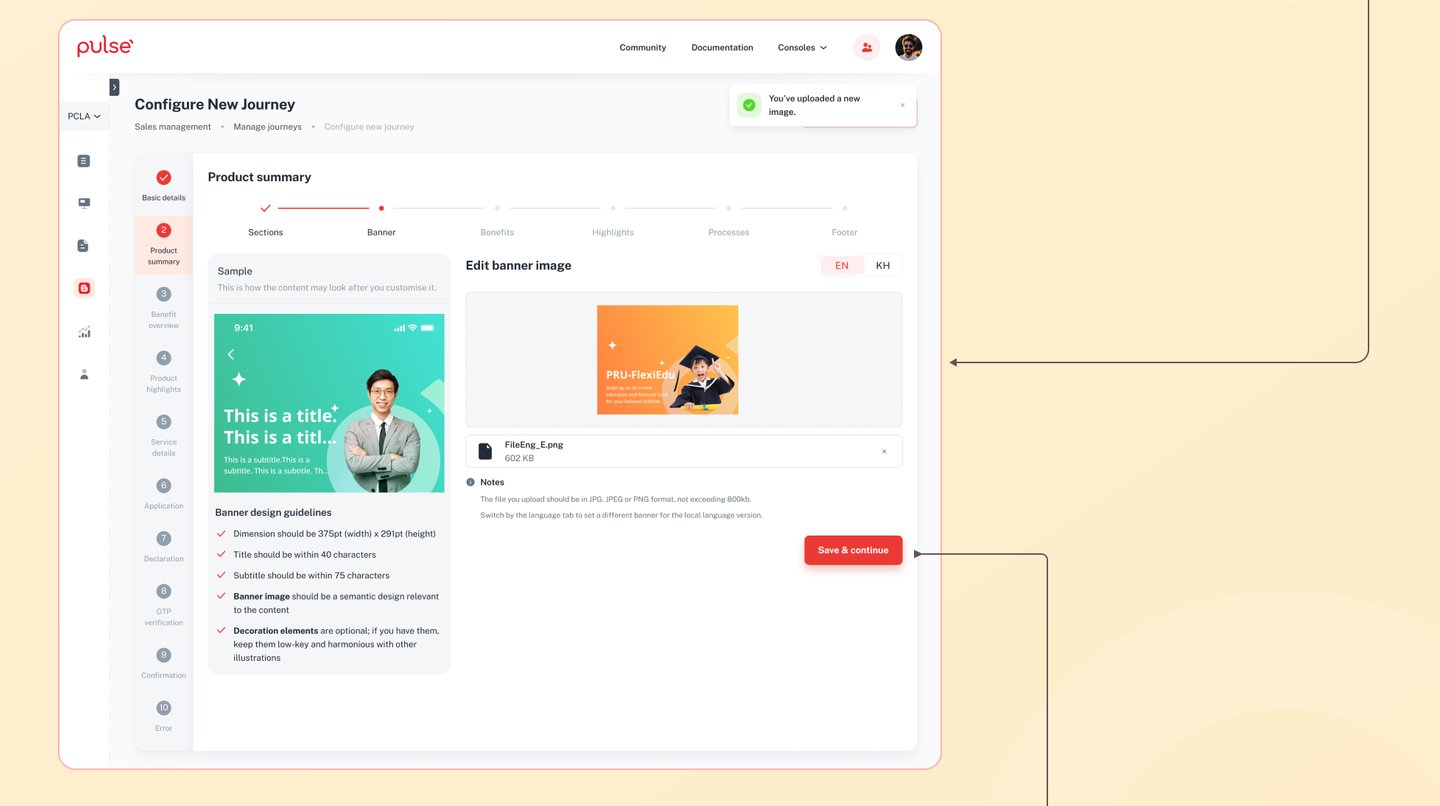
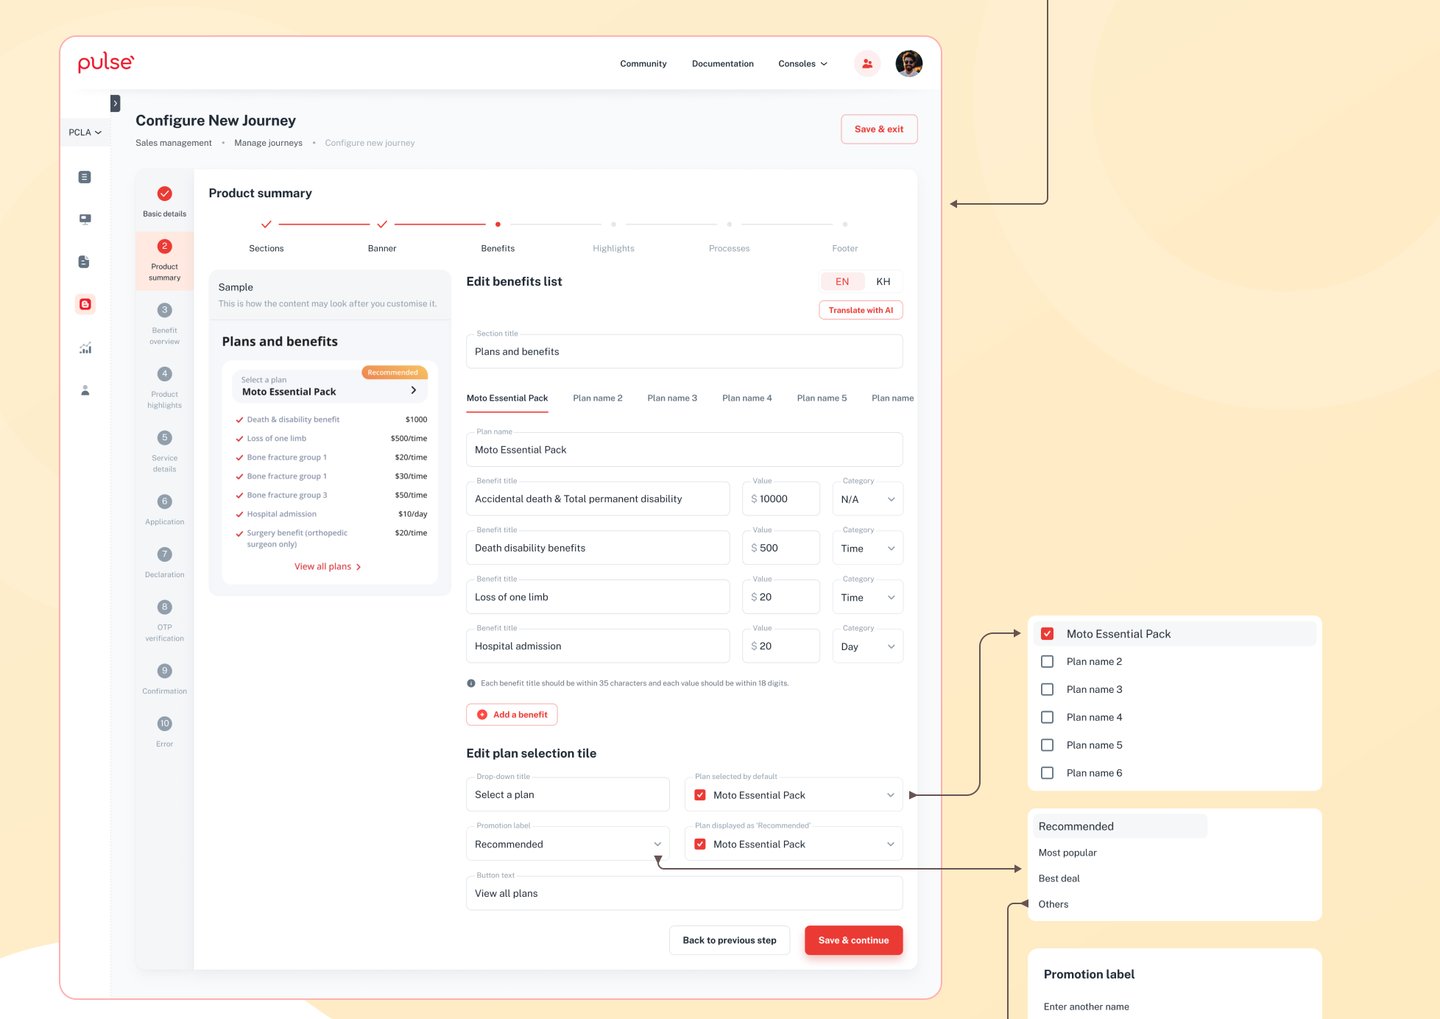
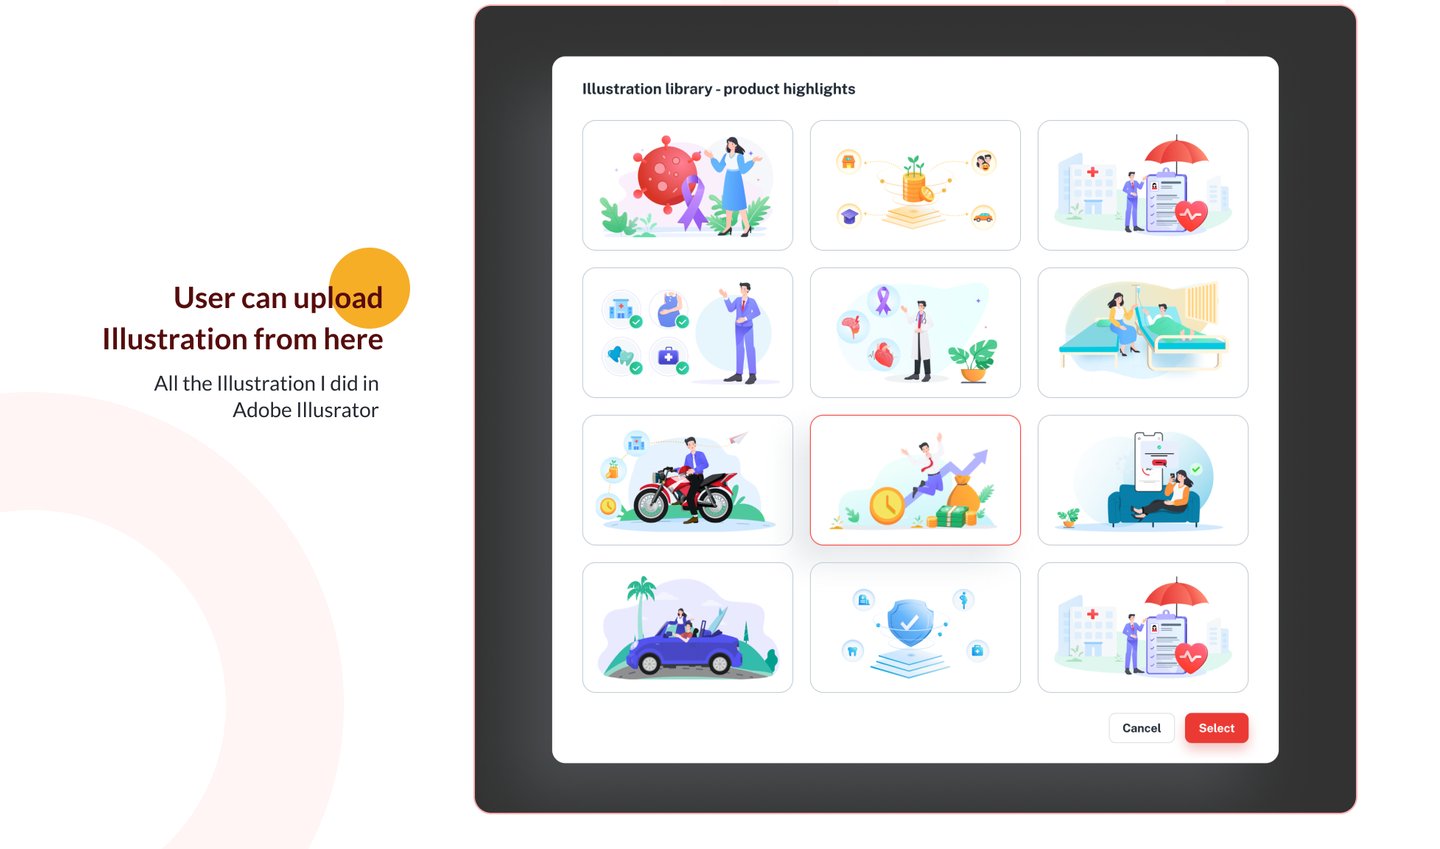
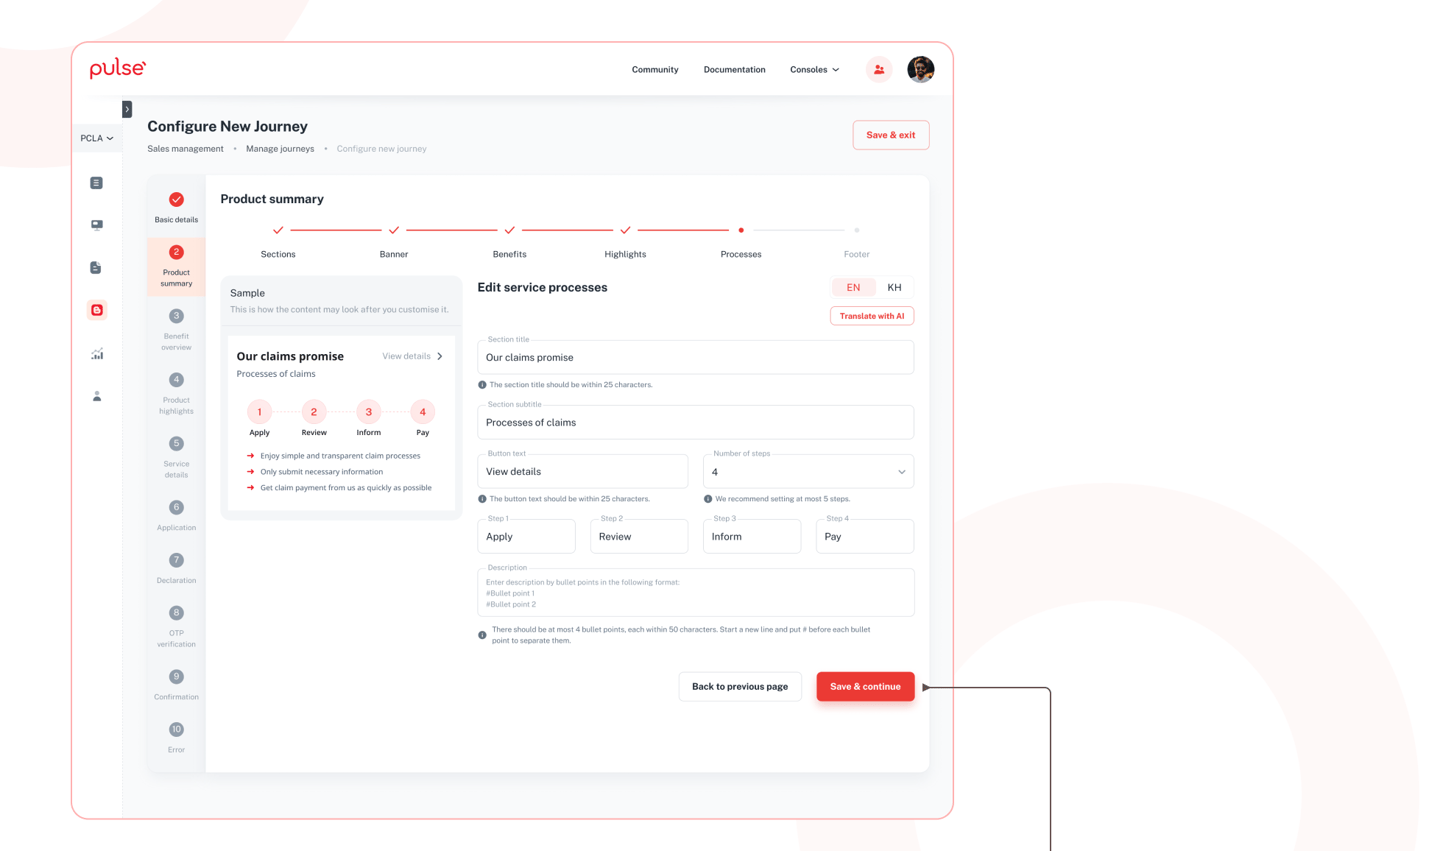
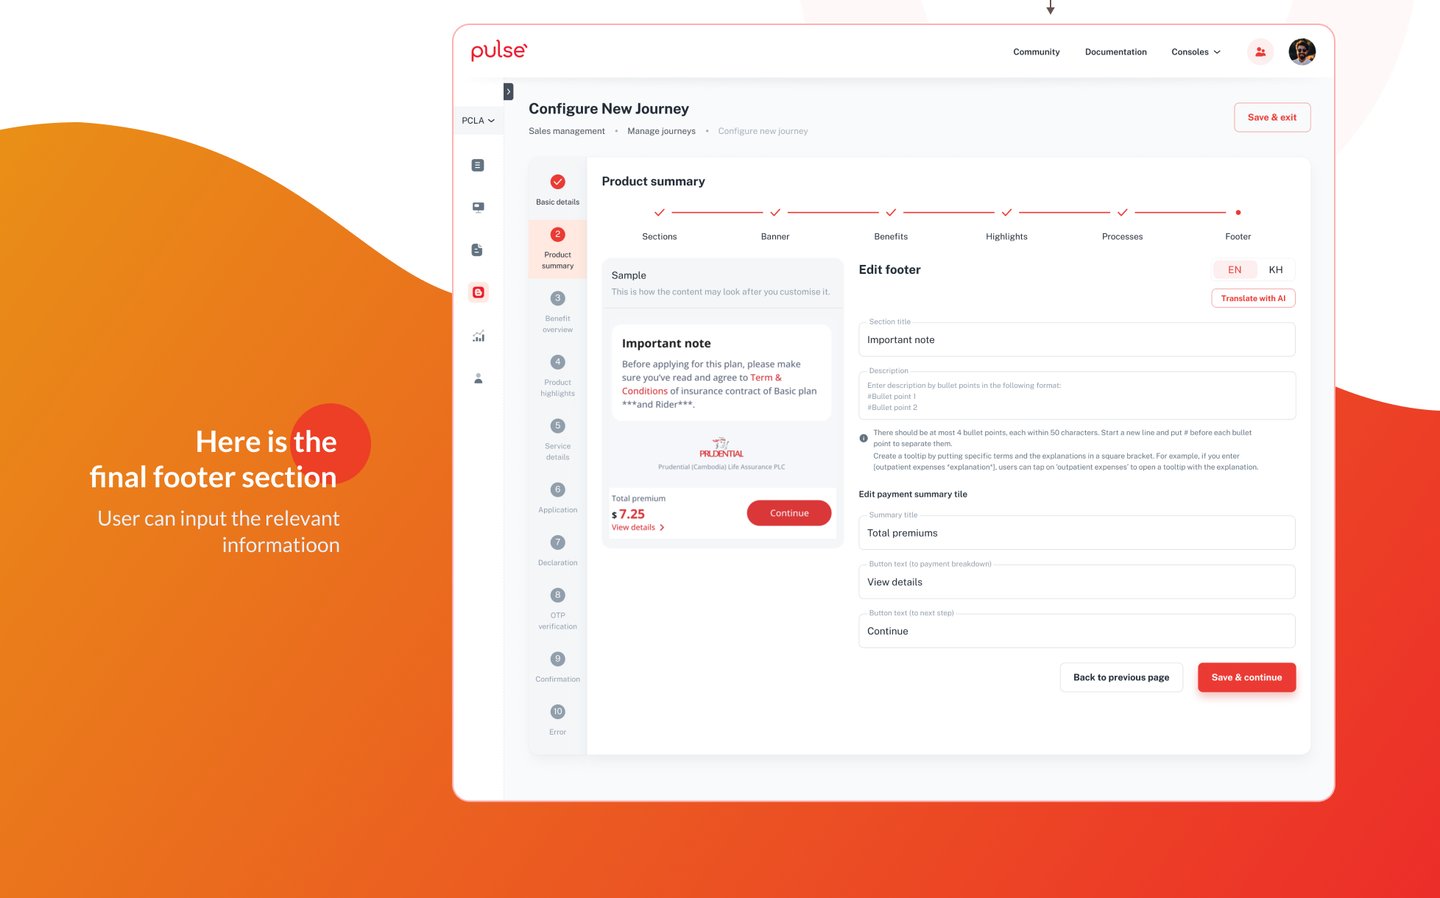
The Prudential internal B2B SaaS products empower various teams, including LBU sales, marketing, operations, and the sales experience team, to create customised mobile pages for selling insurance products. This innovative platform allows users to easily upload banners and incorporate relevant insurance business information, enhancing the overall sales process. With the ability to tailor mobile pages to meet specific needs, teams can effectively engage with potential clients and improve the user experience. By streamlining the presentation of insurance offerings, Prudential enables its teams to leverage technology for better sales outcomes and customer satisfaction in a competitive marketplace.

Business Objectives
Service Design Strategy
1. Service Blueprinting
Create a service blueprint mapping all touchpoints, actors, and processes.
Identify backstage processes and areas for automation.
2. Cross-Functional Collaboration
3. Ecosystem Mapping
Visualize the entire product ecosystem, including third-party integrations.
Ensure seamless communication between systems.
4. Experience Orchestration
Design workflows to ensure users have a consistent experience across all channels.
Monitor user satisfaction and resolve pain points quickly.
Enhancing end-to-end user experiences by aligning people, processes, and technology for seamless service delivery.
Facilitate workshops with sales, marketing, and operations teams.
Align stakeholders on service improvements.
UX Strategy
Vision
To create an intuitive, scalable, and efficient platform that empowers internal teams to configure, launch, and manage insurance products seamlessly.
Goals & Measures
Enhance Usability and Efficiency:
Goal: Reduce product configuration time by 40%.
Measure: Track time-to-market metrics and user task completion time.Empower Self-Management:
Goal: Enable local business units (LBUs) to configure and launch products independently.Measure: Monitor the number of self-launched products and track support ticket reduction.
Improve Decision-Making:
Goal: Provide clear product performance insights to stakeholders.
Measure: User engagement with analytics dashboards and feedback on actionable insights.Boost User Satisfaction:
Goal: Achieve a CSAT score of 90%.
Measure: Conduct regular user satisfaction surveys and usability testing.
Plan
Discovery and Research:
Conduct stakeholder interviews, user surveys, and usability testing.
Identify pain points and map user journeys.Design and Prototyping:
Develop wireframes, low-fidelity prototypes, and interactive high-fidelity designs.
Perform iterative testing and gather feedback.Implementation Support:
Collaborate closely with product, engineering, and business teams.
Ensure design consistency and provide design assets.Validation and Continuous Improvement:
Launch with a phased rollout.
Collect post-launch data, analyze performance, and iterate based on user feedback.
Execution
Phase 1: Core platform design with essential product configuration and management features.
Phase 2: Introduce performance dashboards and enhanced analytics.
Phase 3: Implement automation for product launch processes.
Phase 4: Continuous improvement with user feedback-driven design updates.
By aligning the UX strategy with business objectives, this approach ensures a user-centric, scalable, and efficient insurance product management platform for Prudential.
It aligns design with business goals and user needs, ensuring a seamless experience.
It drives innovation and fosters continuous improvement across platforms.
The goal is to enhance collaboration, ensure transparency, and optimise product performance using a user-centered design approach.
The Challenges
Lack of Centralized Platform: Fragmented workflows and inefficient communication due to the absence of a unified system.
Limited Visibility: Sales and marketing teams struggled to track product configuration progress.
Complex Journeys: Legacy systems caused complicated user experiences, needing simplification.
Scalability Issues: Balancing customization and standardization for diverse LBU needs.
Data Gaps: Lack of actionable insights for informed decision-making.
Resistance to Change: Users were hesitant to adopt new digital systems.
Stakeholder Alignment: Managing diverse expectations across multiple teams.
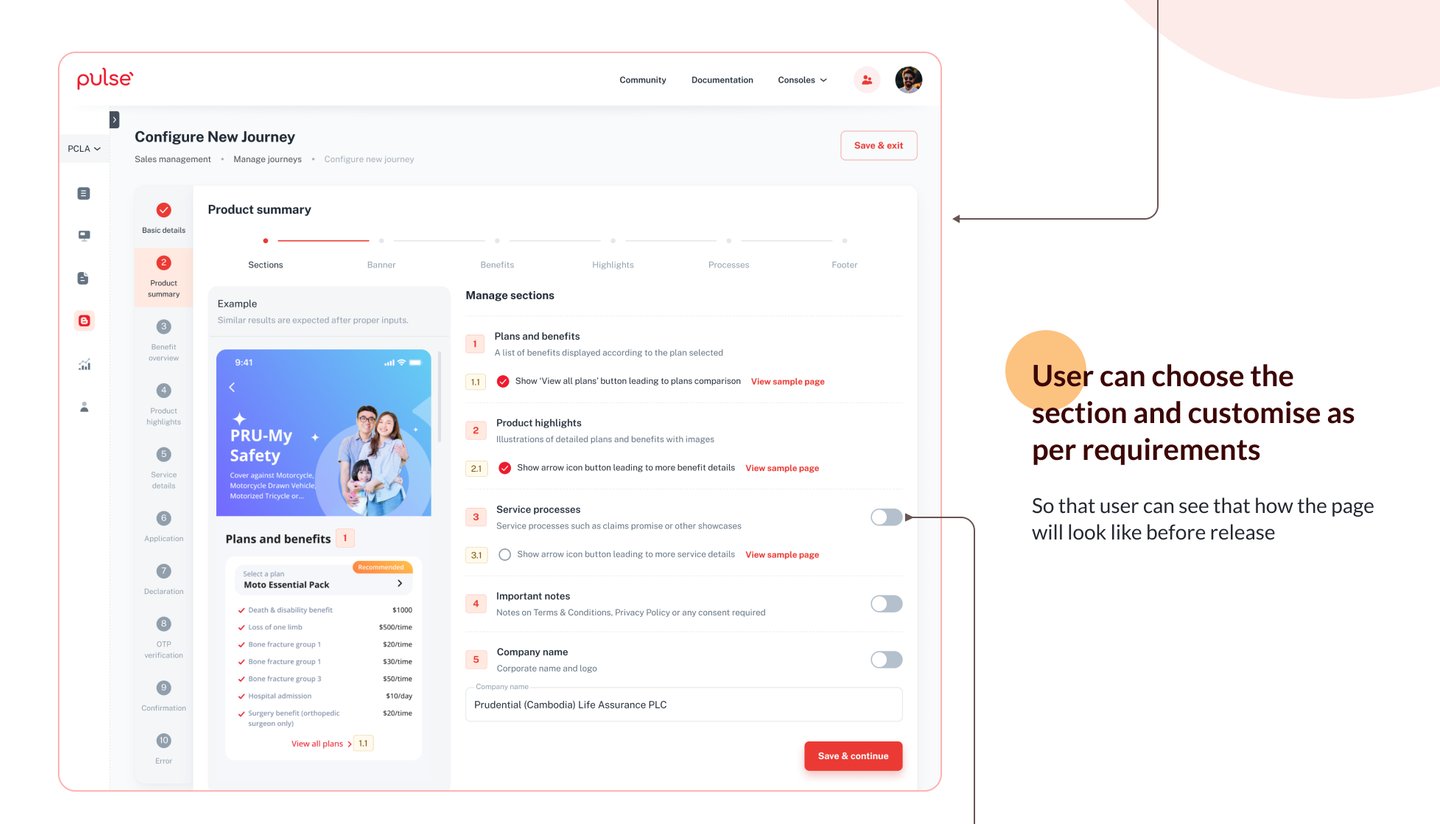
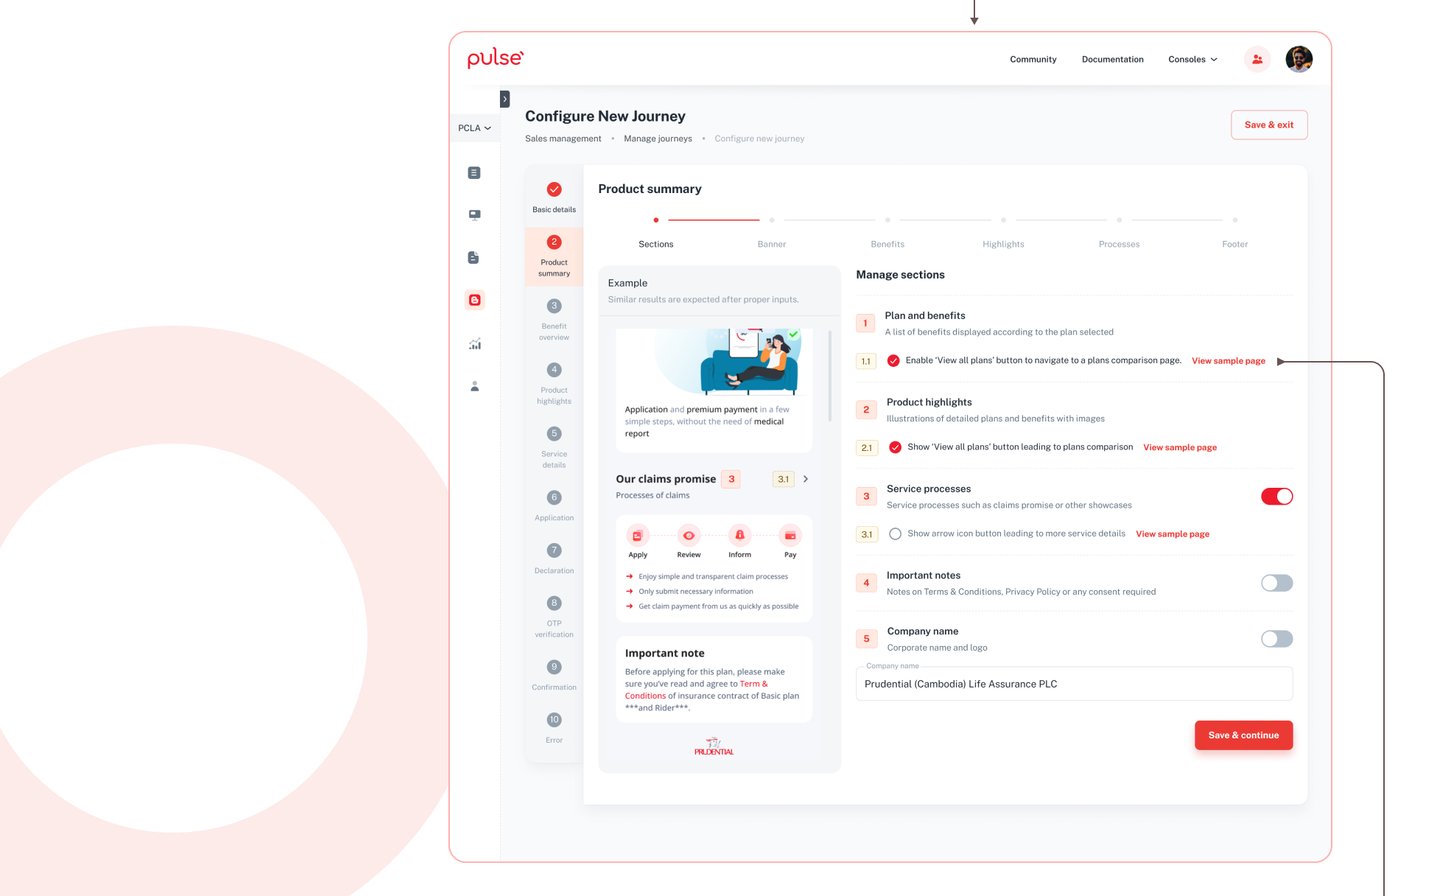
The Solution
Centralized Platform: Developed a unified system for seamless product configuration and collaboration.
Enhanced Visibility: Added real-time dashboards for progress tracking and performance insights.
Simplified UX: Designed intuitive interfaces to reduce complexity and improve user adoption.
Scalable Design: Built flexible components to meet diverse LBU needs.
Data Insights: Integrated analytics for actionable sales and user behavior insights.
Change Support: Offered training and resources to ease the transition.
Stakeholder Alignment: Conducted workshops and feedback sessions for continuous collaboration.
My Role
Lead Product Design
UX Strategy, UX Research, Led IA, Wireframing and Visual design prototyping and testing for web and mobile platforms and was involved in brainstorming research.
Team Lead
Led a team member of fourteen and worked closely with two designers for this project. I have mentored junior designers and maintained a collaborative and creative work environment.
Empathise
Target Users
Male and Female ages 20 to 60 older South Asian, LBU Sales, Operational team, Insurance agents, Business Leads and more
User Pain Points & Insights
In our first round of interviews, we conducted 3 out of 13 interviews with sales team to better understand their feelings towards and experiences with other E2E online platforms. I co-wrote our interview notes, which encouraged storytelling and guided conversation with participants.
User Research Summary
There is no single platform where the business, sales, and product teams execute their plan.
No product management online platform exists where I can see Transparent progress enabling LBUs to launch or withdraw products based on their marketing plan.
There is no digital platform where I can review product sales and analyze user conversion of each distribution channel.
I want flexibility in managing my insurance policies and payments. Manage Insurance legal documents
Qualitative Research
Objective
Understand user emotions, pain points, and behaviors.
Users faced difficulties with outdated interfaces and fragmented systems.
Lack of transparency in insurance product launch status caused frustration.
Users desired more control and flexibility in configuring insurance products.
Methods
User Interviews: Conducted in-depth interviews with LBU sales teams, insurance agents, and operational staff.
Focus Groups: Organized discussions to explore user experiences and gather suggestions.
Observation: Monitored users navigating current systems to identify workflow challenges.
Insights:
Objective
Qualitative Research
Measure user behavior, satisfaction, and platform performance.
Methods
Surveys and Questionnaires: Gathered feedback from a large user base to identify common pain points.
Analytics Data: Analyzed usage metrics from existing systems to identify drop-off points.
Benchmarking: Compared key performance indicators (KPIs) with competitor platforms.
Metrics Collected:
User satisfaction scores
Task completion time
Error rates and success rates
Conversion rates for product configuration
Insights:
70% of users reported delays in launching new insurance products.
60% faced challenges in managing product sales data.
80% desired a self-service platform to reduce dependency on technical teams.
USER PERSONA
Age: 34, Sales Manager, Digital Insurance Product
Michael Anderson


Attitude: Transparent progress enabling LBUs to launch or withdraw products based on their marketing plan. I believe that investing in my health is the key to living my best
Challenges & pain points
Tasks & activities
Touch points & channels
Struggles with legacy systems that haven't adapted to modern practices.
Finds difficulty aligning product development timelines with marketing campaigns.
Experiences resistance to change from team members accustomed to outdated methods.
Has trouble garnering clear customer requirements before product launches.
Consistently review competitor offerings to identify areas for differentiation.
Engage with clients to collect critical feedback regarding product performance.
Prioritize product enhancements based on quantitative research and qualitative input.
Attend training sessions to stay updated on industry standards and regulations.
Struggles with legacy systems that haven't adapted to modern practices.
Finds difficulty aligning product development timelines with marketing campaigns.
Experiences resistance to change from team members accustomed to outdated methods.
Has trouble garnering clear customer requirements before product launches.
User Journey Map Key Features
DEFINE & IDEATE
We combined our research and observed where our target users’ problems existed. We analyzed our insights using affinity diagramming, a method for gathering large amounts of data and organizing them into groups or themes based on their relationships.

Starting the Design
Paper Prototypes

Digital Wireframes
Low-Fidelity Prototype
High-Fidelity Prototype
Usability studies
I used
Pass Design System
to create the amazing design
Prototype
A final UX prototype is a near-final version of a digital product or interface that is ready to be handed off to the development team. It is an interactive model that simulates the user experience and is used to validate the design concept before the final product is released.
Metrics to Measure Success
User Experience Metrics:
Task Completion Rate:
Input: Number of users completing product configuration tasks / Total number of users attempting tasks
Goal: >90% completion rateTime on Task:
Input: Total time taken for configuration tasks / Number of tasks completed
Goal: Reduce time by 30% within 6 monthsError Rate:
Input: Number of configuration errors / Total configuration attempts
Goal: <5% error rateUser Satisfaction (CSAT):
Input: Survey score from users (1-5 or 1-10) post-configuration
Goal: Achieve a CSAT score of 4.5 or above
Business Impact Metrics:
Time to Market:
Input: Average time from product configuration to launch
Goal: Reduce time to market by 40% within a yearSales Conversion Rate:
Input: Number of sales through configured product pages / Total visits to product pages
Goal: Increase conversion rate by 20%Product Launches:
Input: Number of products configured and launched per quarter
Goal: 10-15 product launches per quarterOperational Efficiency:
Input: Reduction in manual tasks reported by teams
Goal: Achieve 50% reduction in manual work
Adoption & Engagement Metrics:
Active User Rate:
Input: Number of active users per month / Total registered users
Goal: Maintain an 80% active user rateFeature Utilization:
Input: Frequency of feature use (e.g., banner upload, sales rule configuration)
Goal: Ensure 70% of users engage with core features weeklyTraining Completion:
Input: Number of users completing training / Total enrolled users
Goal: 90% training completion rate within the first 30 days
Performance Metrics:
System Uptime:
Input: Total uptime hours / Total operational hours
Goal: 99.9% uptimePage Load Time:
Input: Average time for a page to load (measured in seconds)
Goal: <2 seconds per pageIssue Resolution Time:
Input: Average time taken to resolve user-reported issues
Goal: Resolve 90% of issues within 24 hours