Prudential Insurance
Insurance Product Configuration
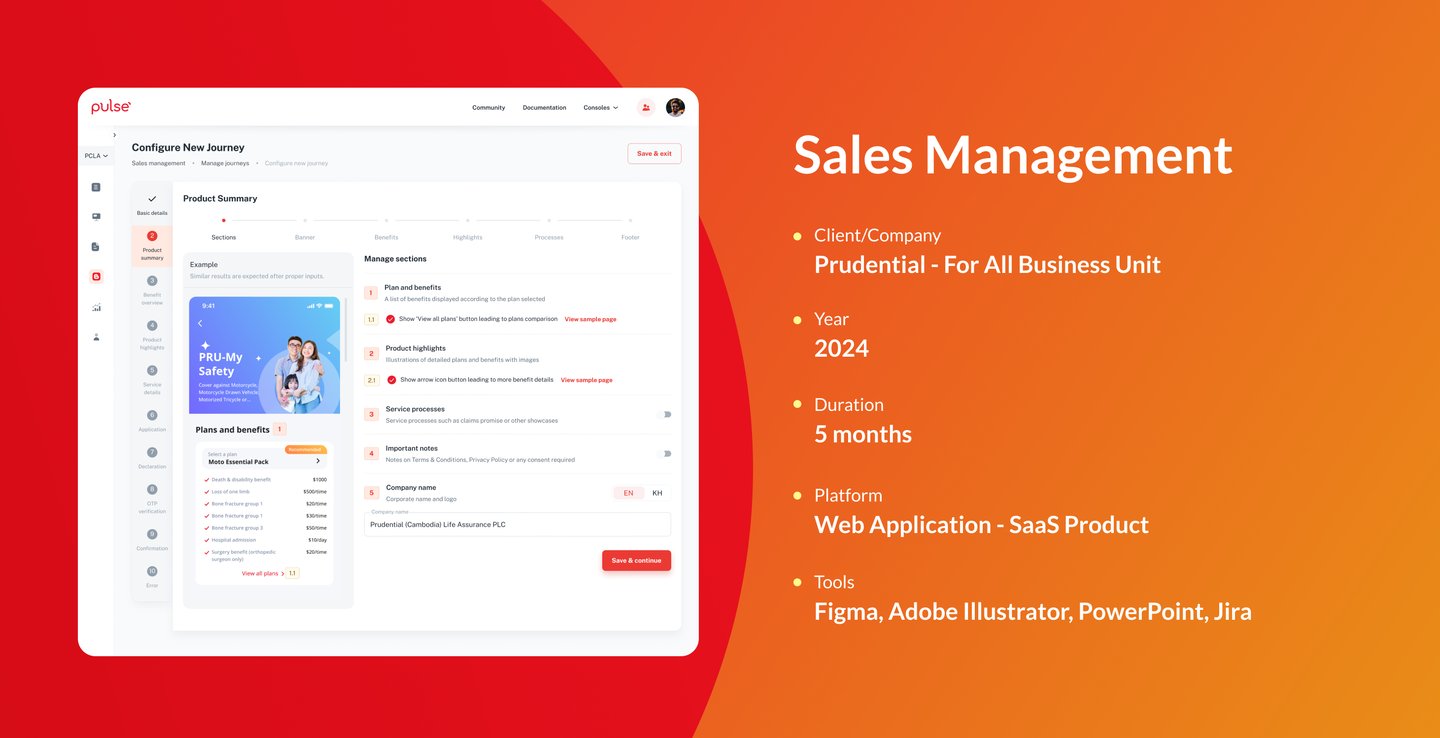
Overview
Prudential, one of Asia’s largest insurance providers, wanted to modernize its digital insurance sales experience to better serve agents and end-users in Singapore, Malaysia, Hong Kong, Vietnam, India and the Philippines. The aim was to create a desktop, tablet and mobile, intuitive platform for purchasing insurance products and managing related tasks—compliant, simple, and efficient.
Problem
There is no single platform where the business, sales, and product teams execute their plan. Despite the growing demand for digital insurance solutions, Prudential's existing online platforms in Singapore and the Philippines were not effectively serving their users—insurance agents and end-customers.

There was an urgent need to redesign the mobile and web experience to streamline the insurance buying journey, build trust, and improve usability for both agents and customers in a mobile-first ecosystem.
The platforms suffered from poor performance, complex user flows, overwhelming compliance content, and lack of trust in digital transactions. Users struggled to compare products, complete applications efficiently, and access real-time updates. As a result, sales conversions were low, and agent productivity was hampered.
The Challenges
We encountered three key challenges:
Complex Products: Too many insurance plans led to choice overload and poor comparison experiences for users.
Compliance Burden: The regulatory environment required long disclosures that overwhelmed users.
Low Digital Trust: Users hesitated to buy insurance online due to a lack of trust and clarity.
In addition, performance issues and a fragmented user journey led to a drop in agent productivity and end-user conversions.
The Solution
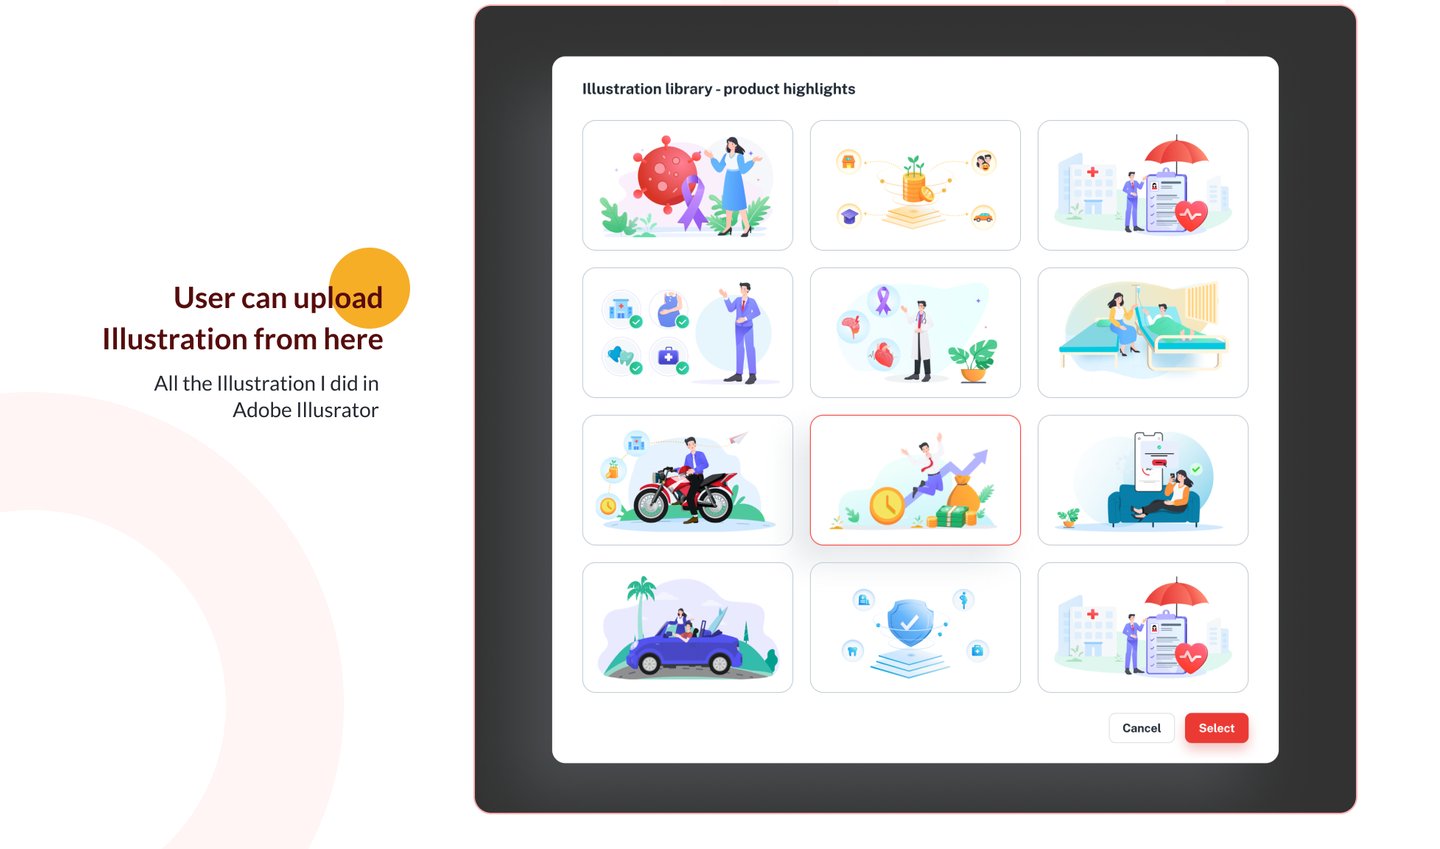
Simplified Product Discovery: Designed intuitive comparison tools to help users easily browse and understand multiple insurance plans.
Streamlined Compliance: Broke down regulatory disclosures into bite-sized, user-friendly formats integrated into key touchpoints.
Built Digital Trust: Enhanced visual clarity, added transparent policy details, and included testimonials to boost user confidence in online purchases.
Improved Performance: Optimized mobile and web platforms for faster loading and smoother navigation.
Unified User Journey: Mapped and redesigned flows for both agents and customers to ensure a seamless and consistent experience.
My Role
As the Lead Product Designer
Project Goals
Build a mobile-first platform for both agents and end-users.
Simplify the insurance buying journey.
Reduce drop-offs caused by compliance clutter and usability gaps.
Provide agents with a smoother, faster path to assist customers digitally.
Defined the information architecture and user flows.
Created wireframes and visual design prototypes for desktop, tablet and mobile.
Conducted usability testing and synthesized research findings.
Collaborated with stakeholders and engineering teams on feature prioritization and backlog grooming.
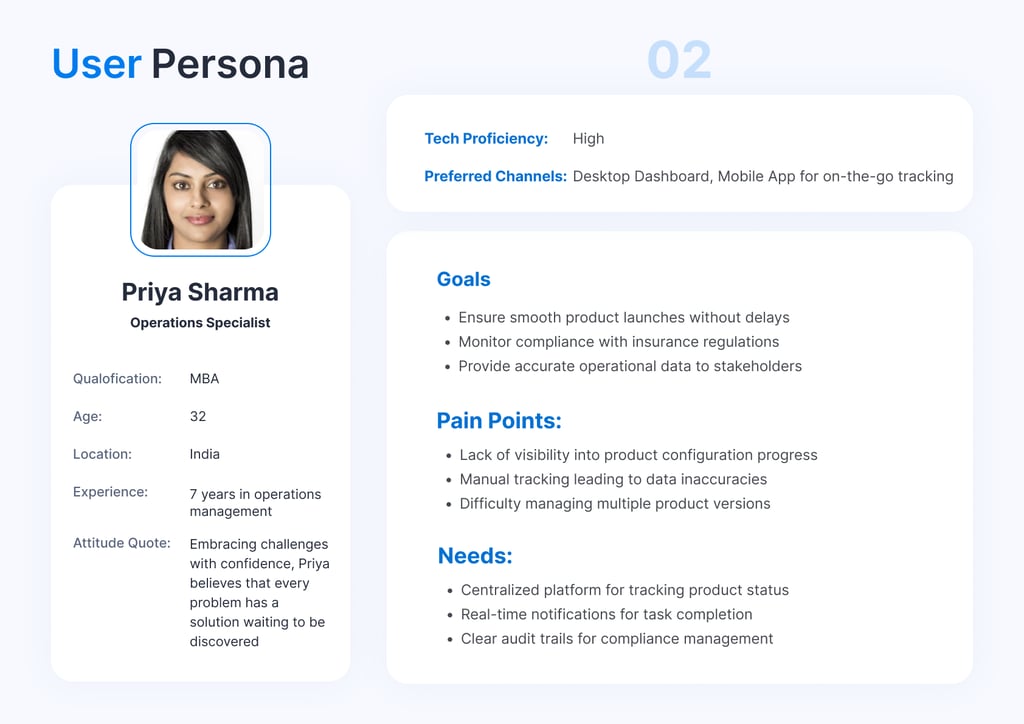
User Research
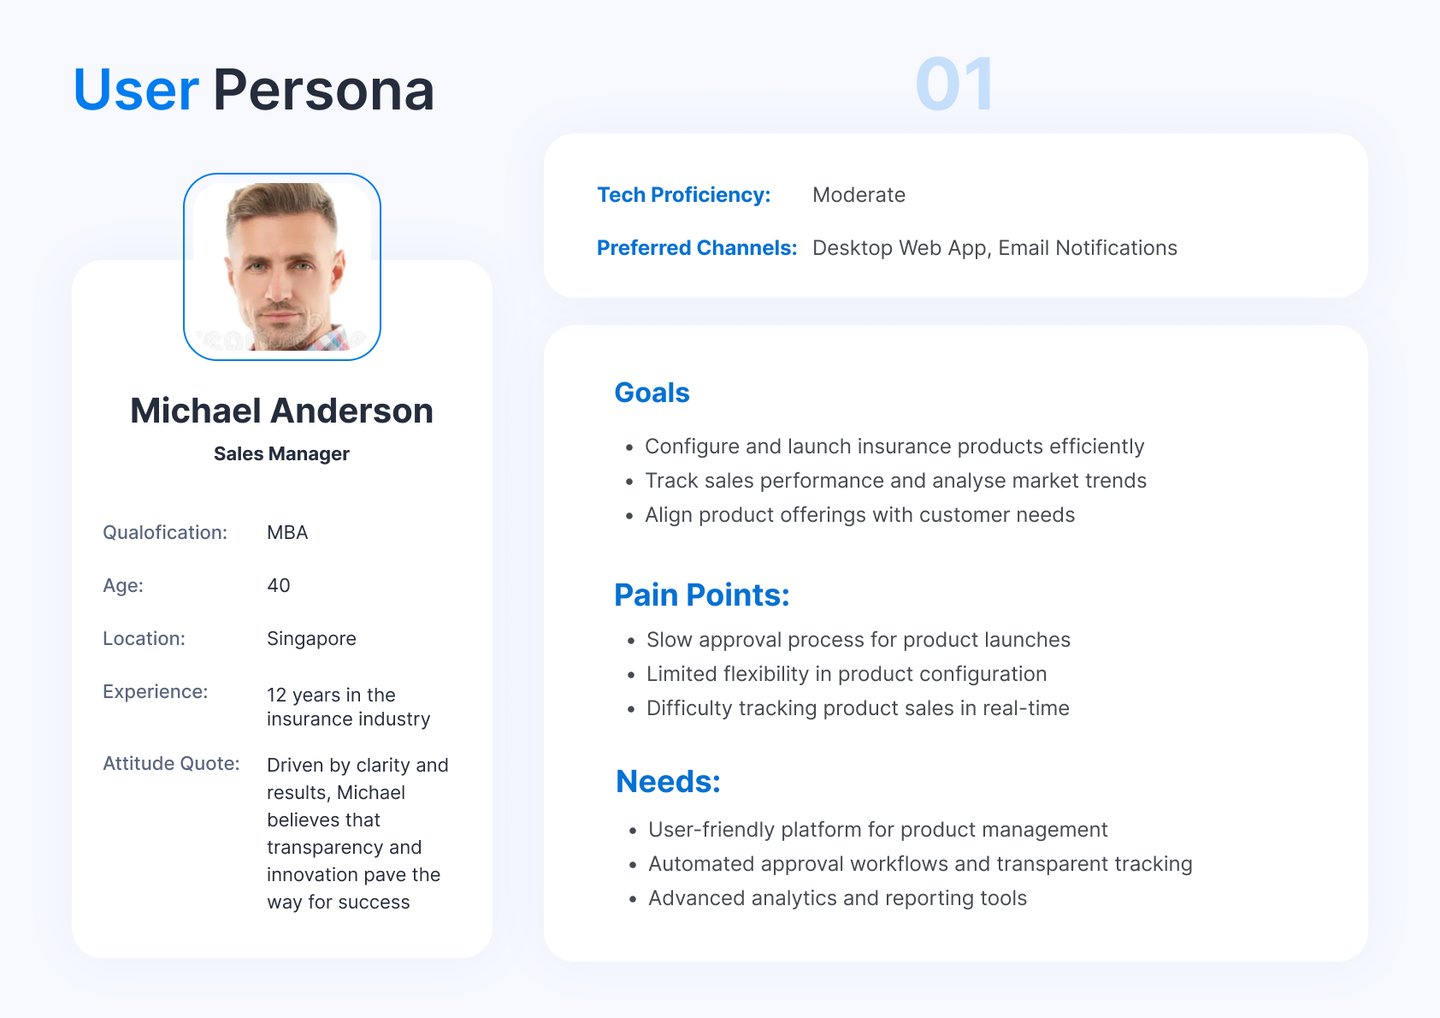
Target Users
Insurance Agents: Primary drivers of sales who needed performance-friendly, reliable tools on mobile.
End-Users (Customers): Individuals aged 20–60, primarily in South Asia, with varying levels of tech savviness and insurance knowledge.
Research Objectives:
Understand pain points of insurance agents and end-customers while using the existing digital platforms.
Identify usability issues affecting product discovery, trust, and transaction completion.
Explore expectations and behaviors around buying insurance digitally.
Research Methods:
Stakeholder Interviews: To align on business goals, compliance needs, and sales challenges.
User Interviews: Conducted 13 interviews (5 with insurance agents, 8 with customers).
Competitor Analysis: Studied local and global insurance apps for best practices.
Survey: Distributed a lightweight survey to gather user preferences and trust indicators.
Key Insights:
Overwhelming Information: Users struggled to process too many plans and dense policy content.
Time-consuming Tasks: Application flows were long, especially on mobile, reducing user motivation.
Lack of Trust Signals: Users did not feel secure purchasing high-value policies online.
Low Discoverability: Useful features (e.g., calculators, advisor chat) were buried or unclear.
Agent Frustrations: Agents needed better tools to assist customers and monitor progress in real time.
Define & Ideate:
Using Affinity Mapping, we clustered research findings to identify themes:
Clarity in plan comparison
Minimize compliance fatigue
Empower agents with real-time policy status
Simplify payments and follow-ups
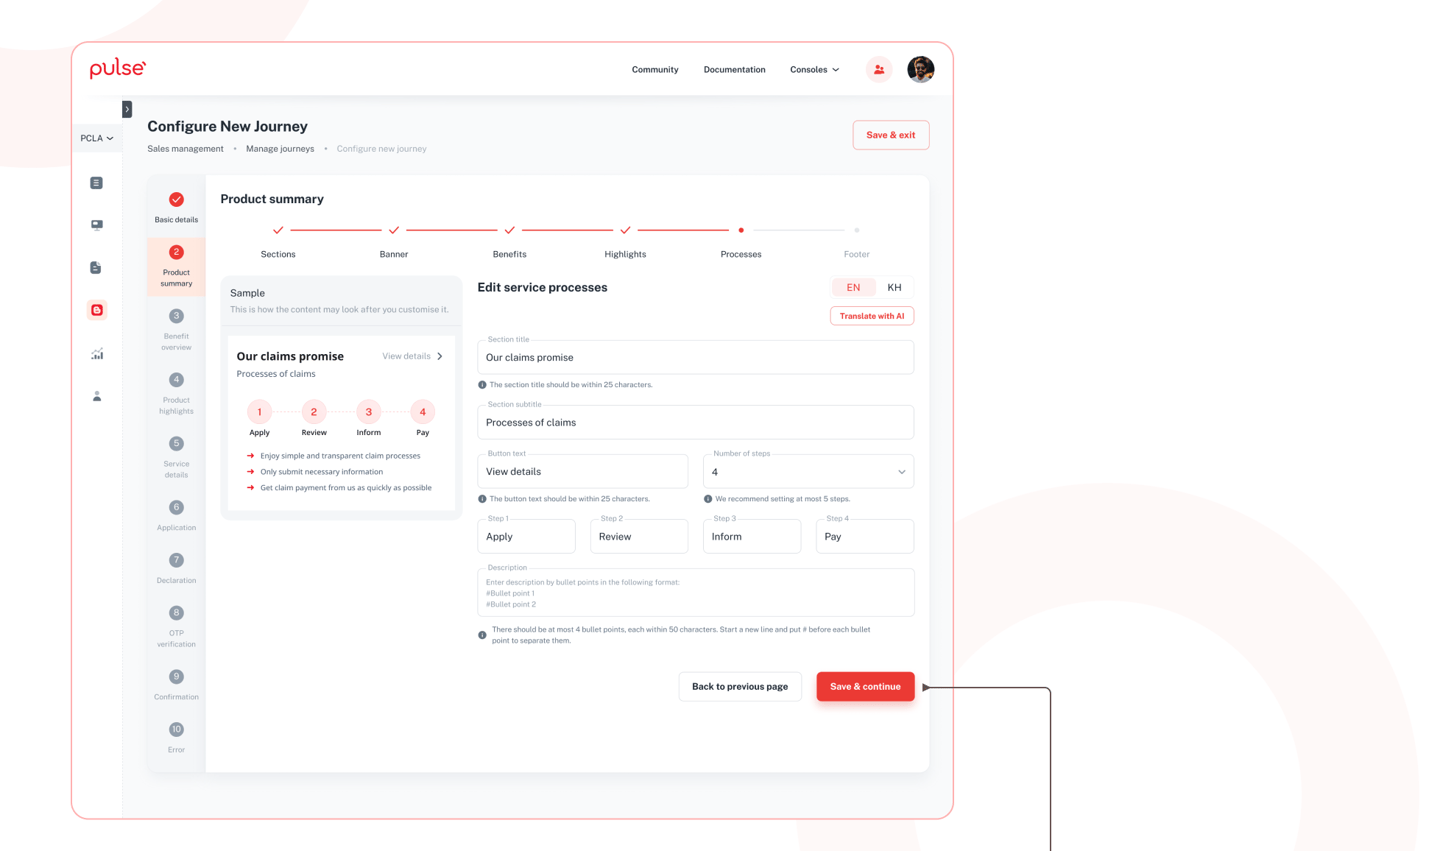
We then restructured the flows to reduce cognitive load, introducing:
Micro-steps for policy applications
Tooltips for disclosures
Smart filters to compare plans
QuickPay module for faster transactions
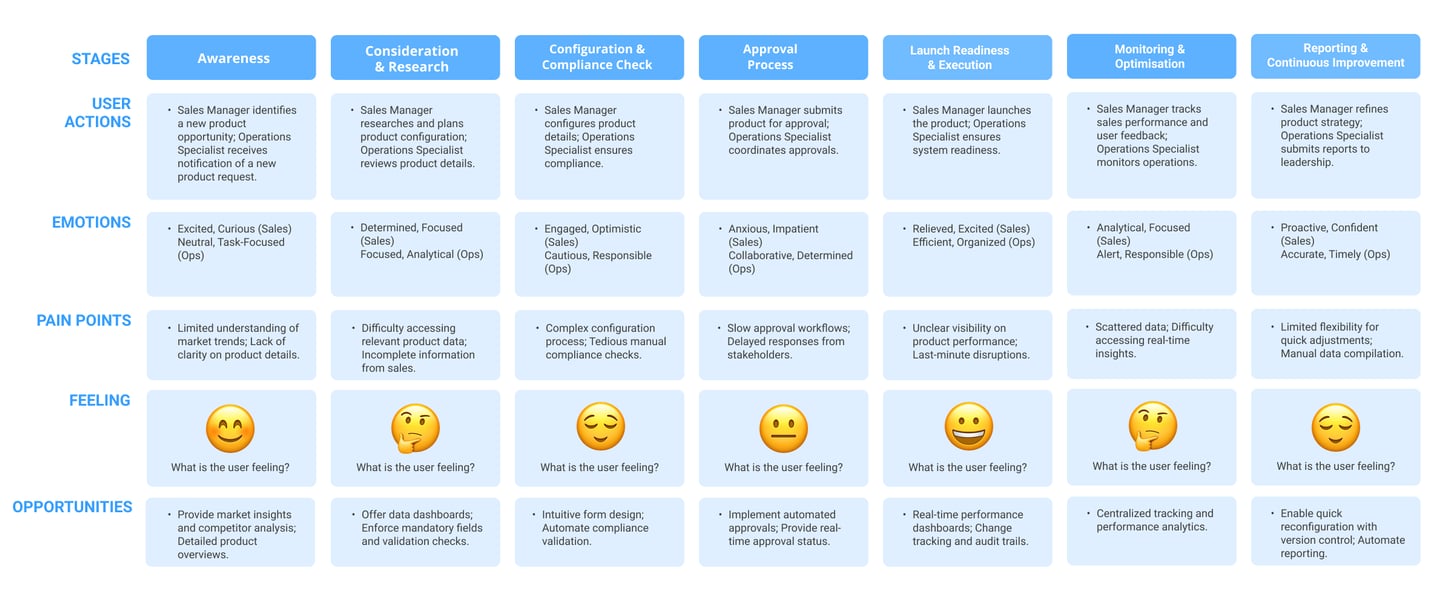
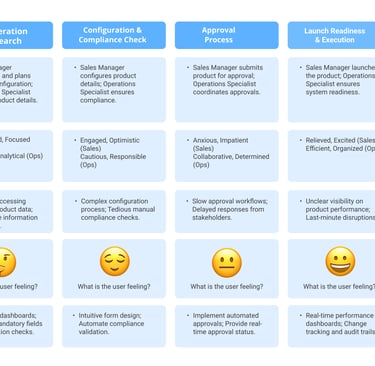
User Journey Map
User journey mapping visualizes a user's interactions with a product or service, highlighting pain points and opportunities for improvement.

Competitor Analysis
To ensure Prudential’s Sales Management (Insurance Product Configuration) platform remains competitive, we analysed key players in the insurance technology space. The focus was on their product offerings, user experience, features, and differentiators.
Ease of Configuration: Competitors like Duck Creek offer low-code solutions. Prudential can leverage drag-and-drop product setup to simplify configuration.
Automation & AI: AI-driven recommendations and automated workflows can improve efficiency, similar to Salesforce’s AI-driven insights.
User Experience: Simplifying product setup and integrating real-time analytics will enhance usability, making the platform more competitive.
Customisation & Scalability: While competitors offer enterprise-level solutions, Prudential can focus on flexibility for mid-sized and large insurers.
Competitive Insights & Opportunities
I used
Pass Design System
to create the amazing design
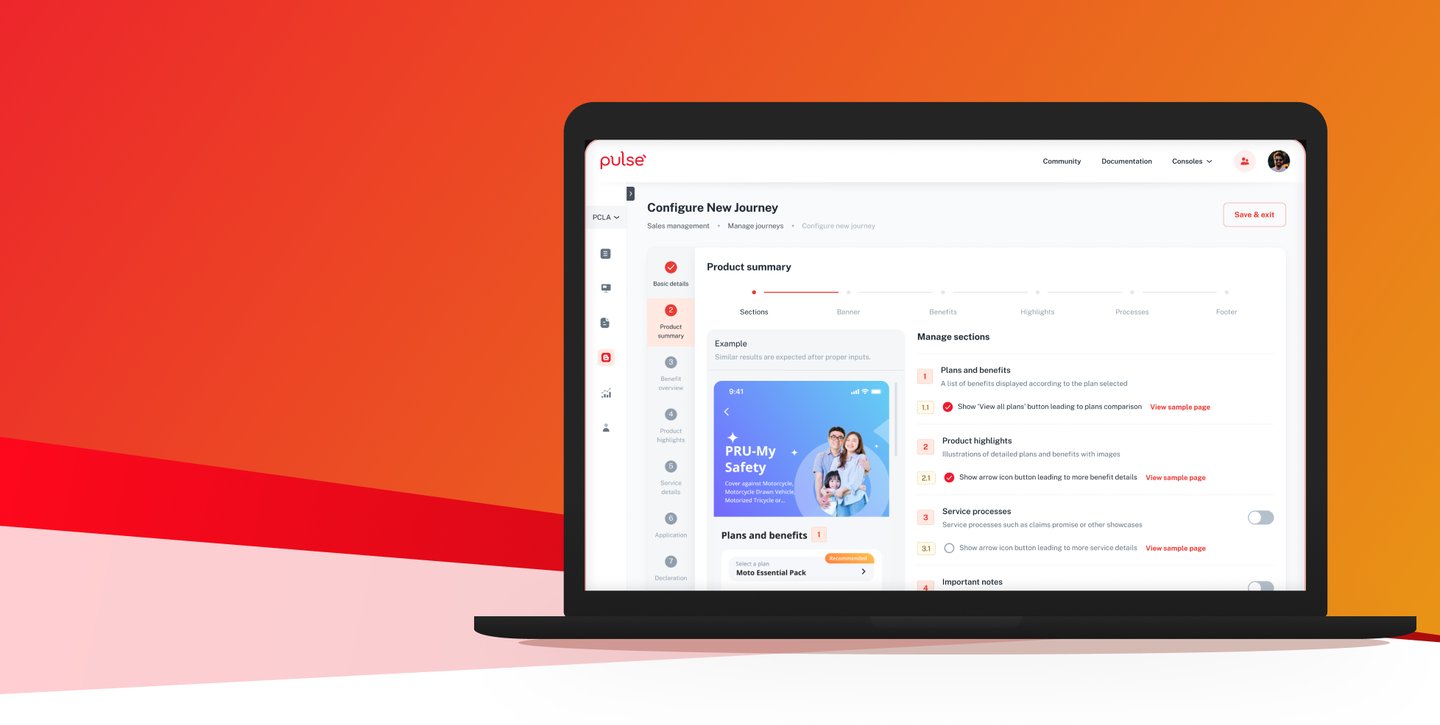
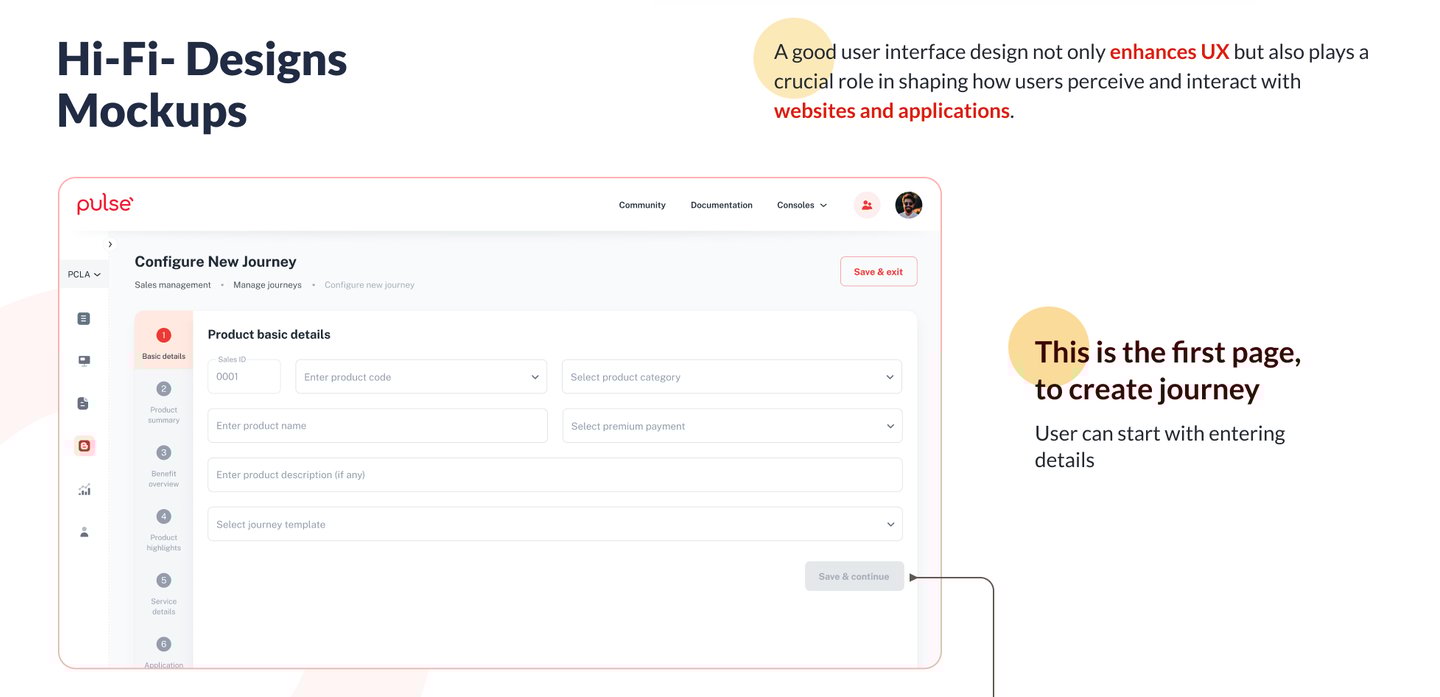
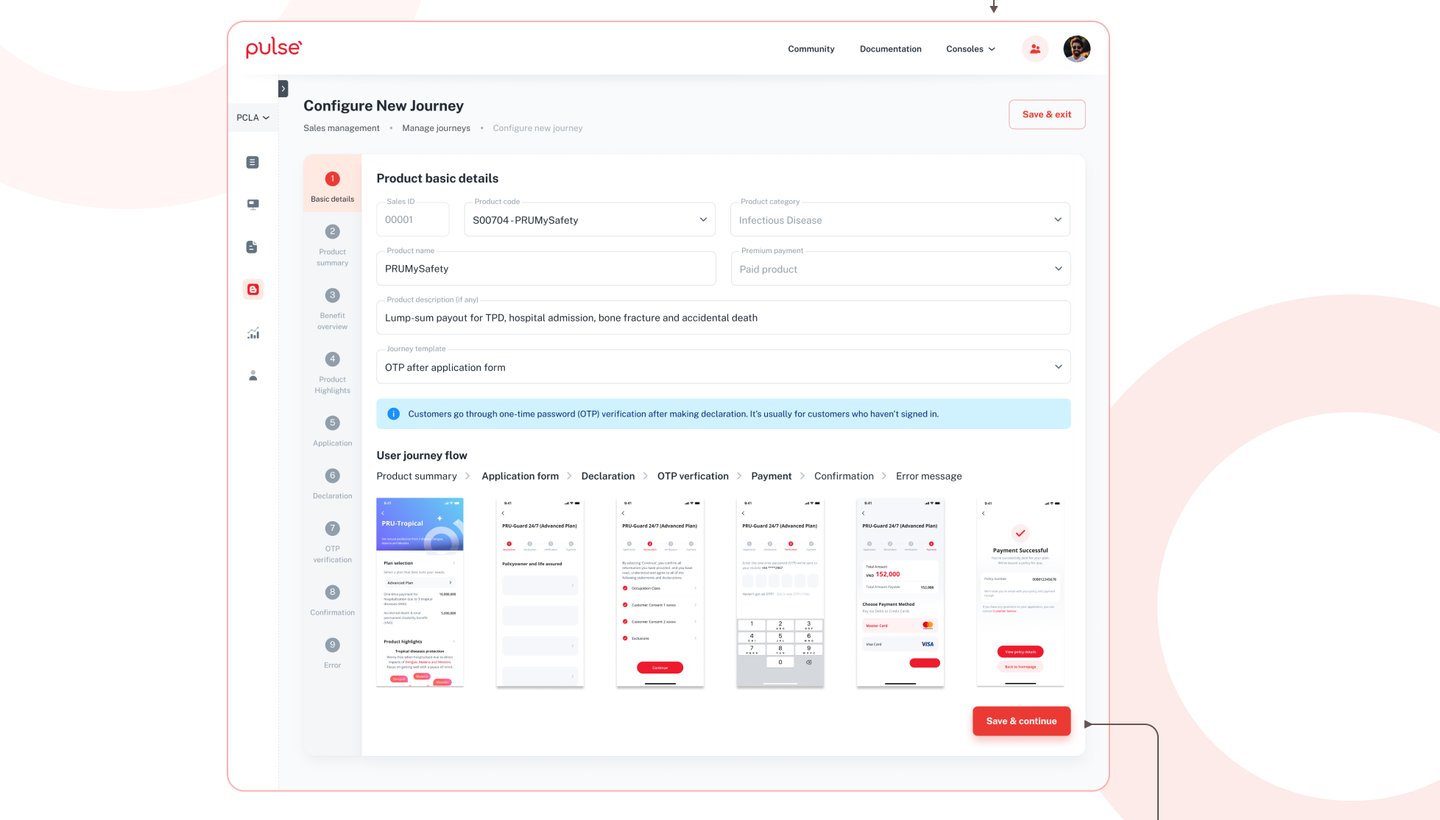
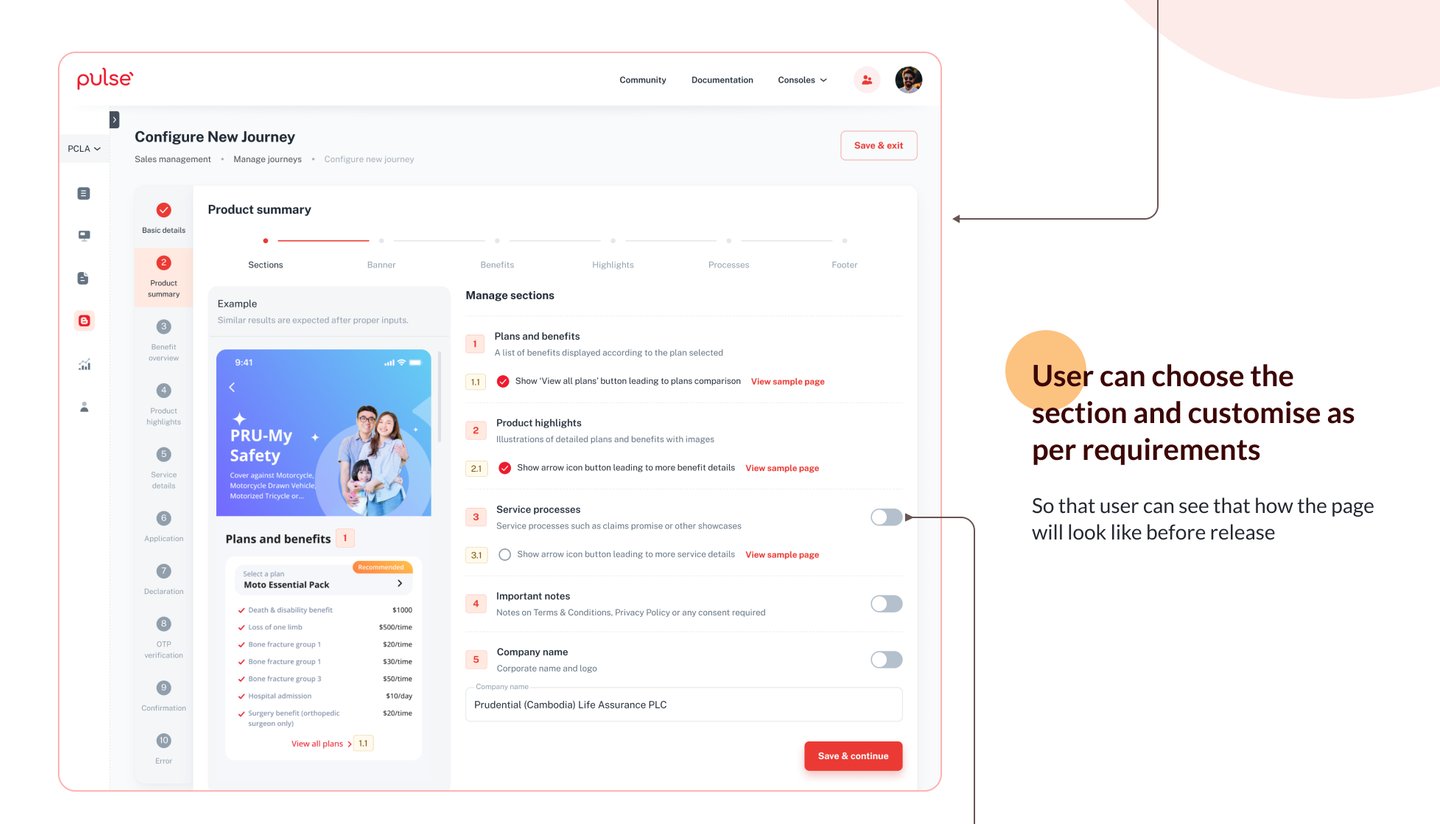
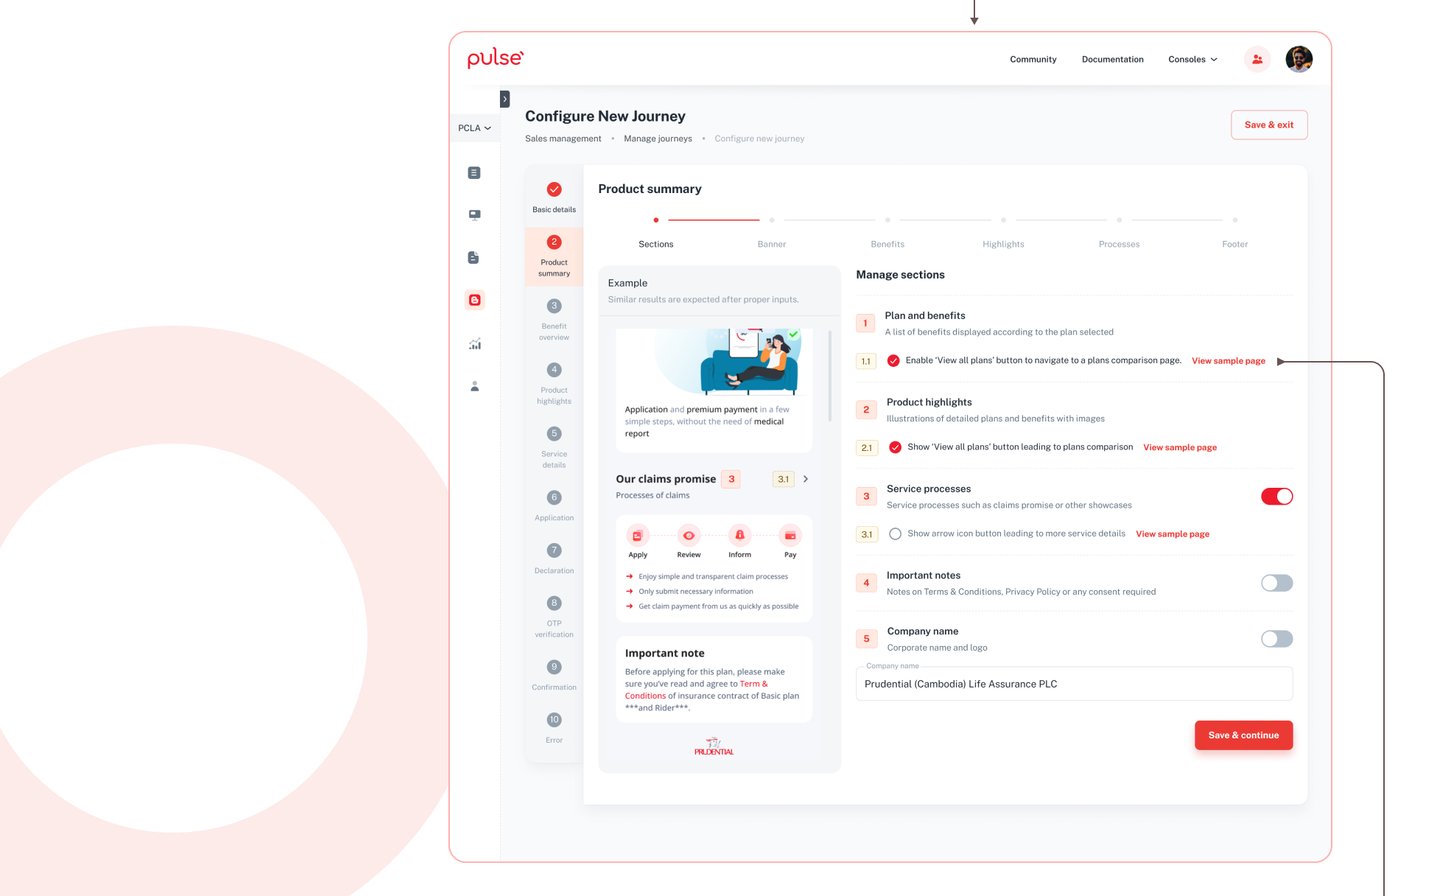
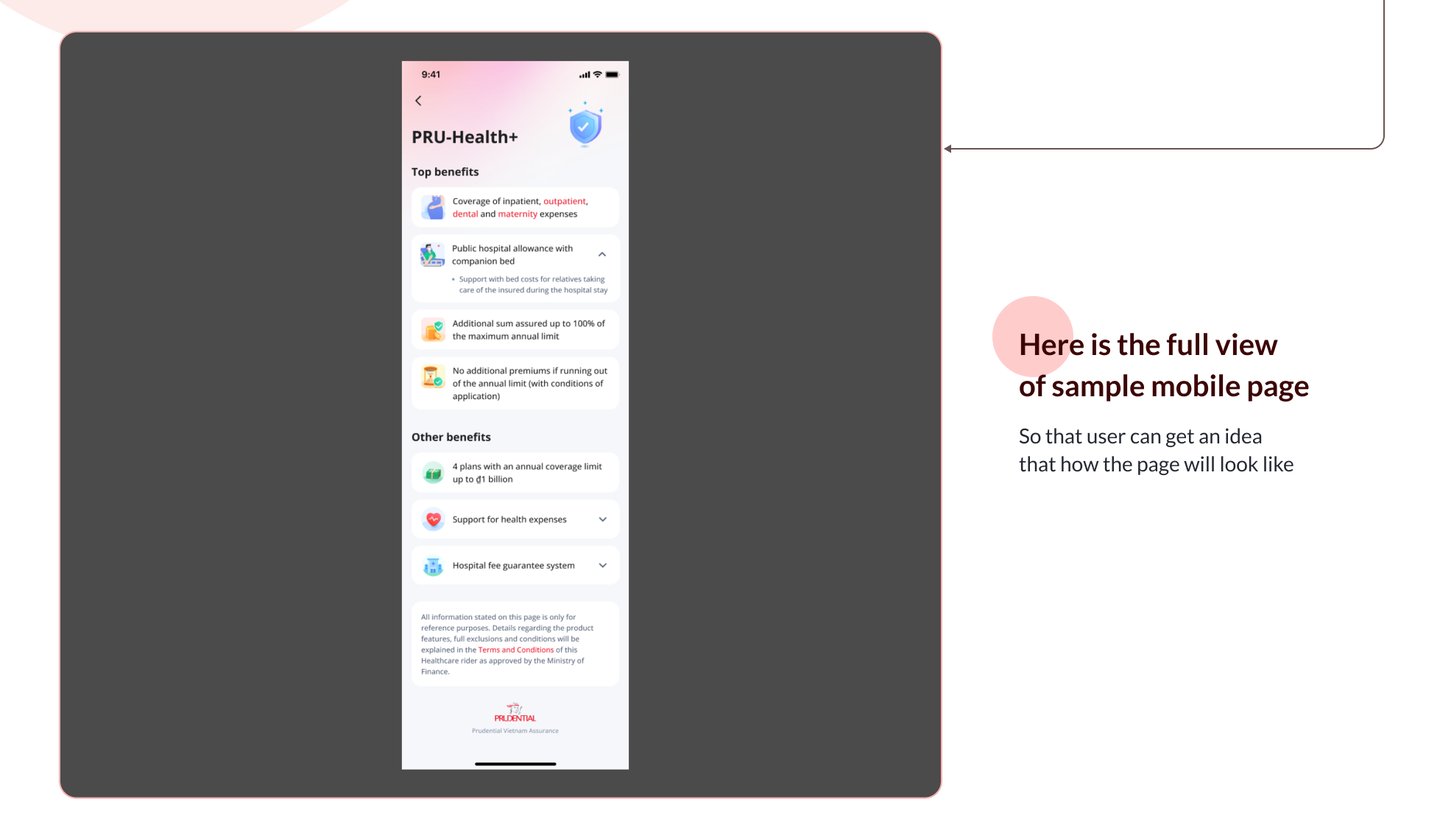
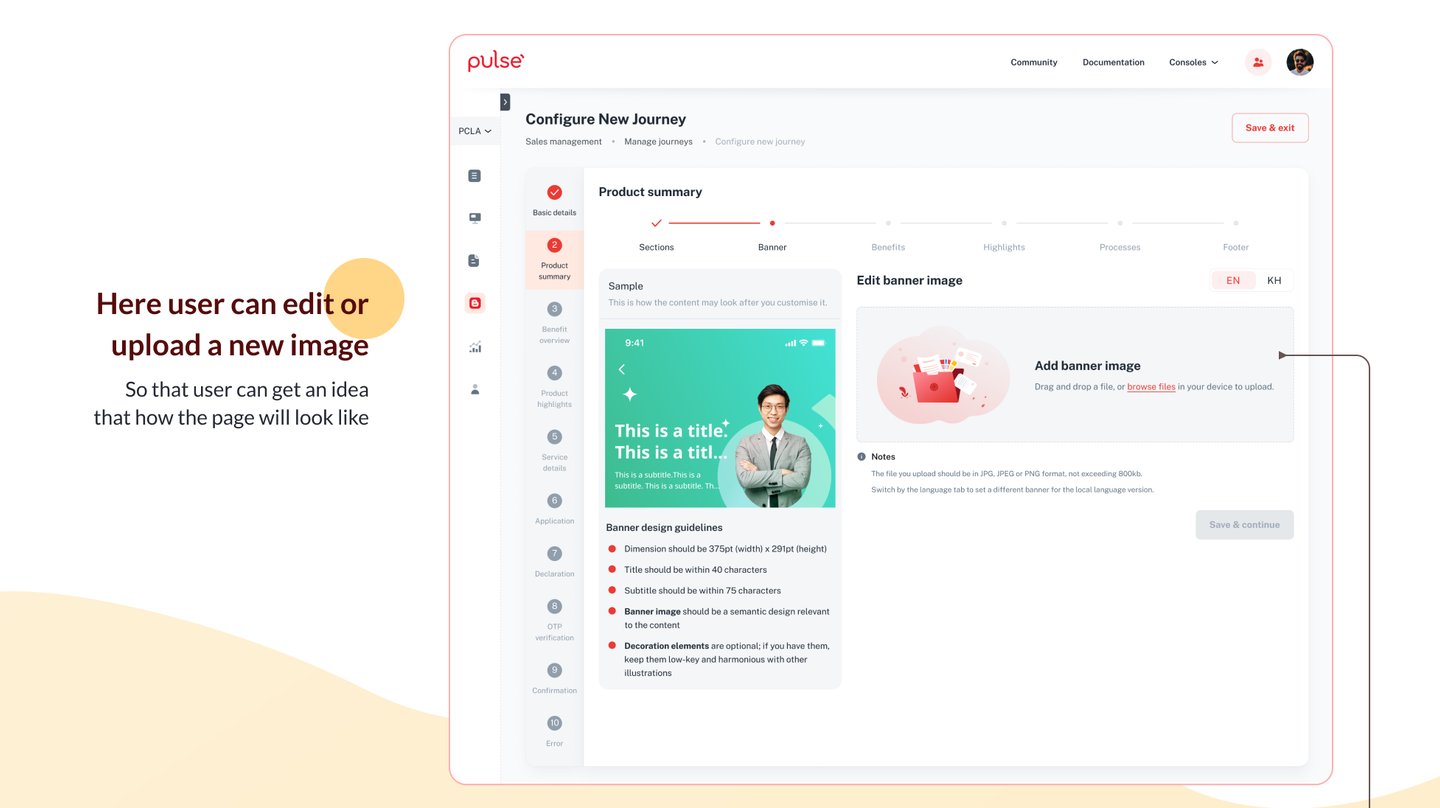
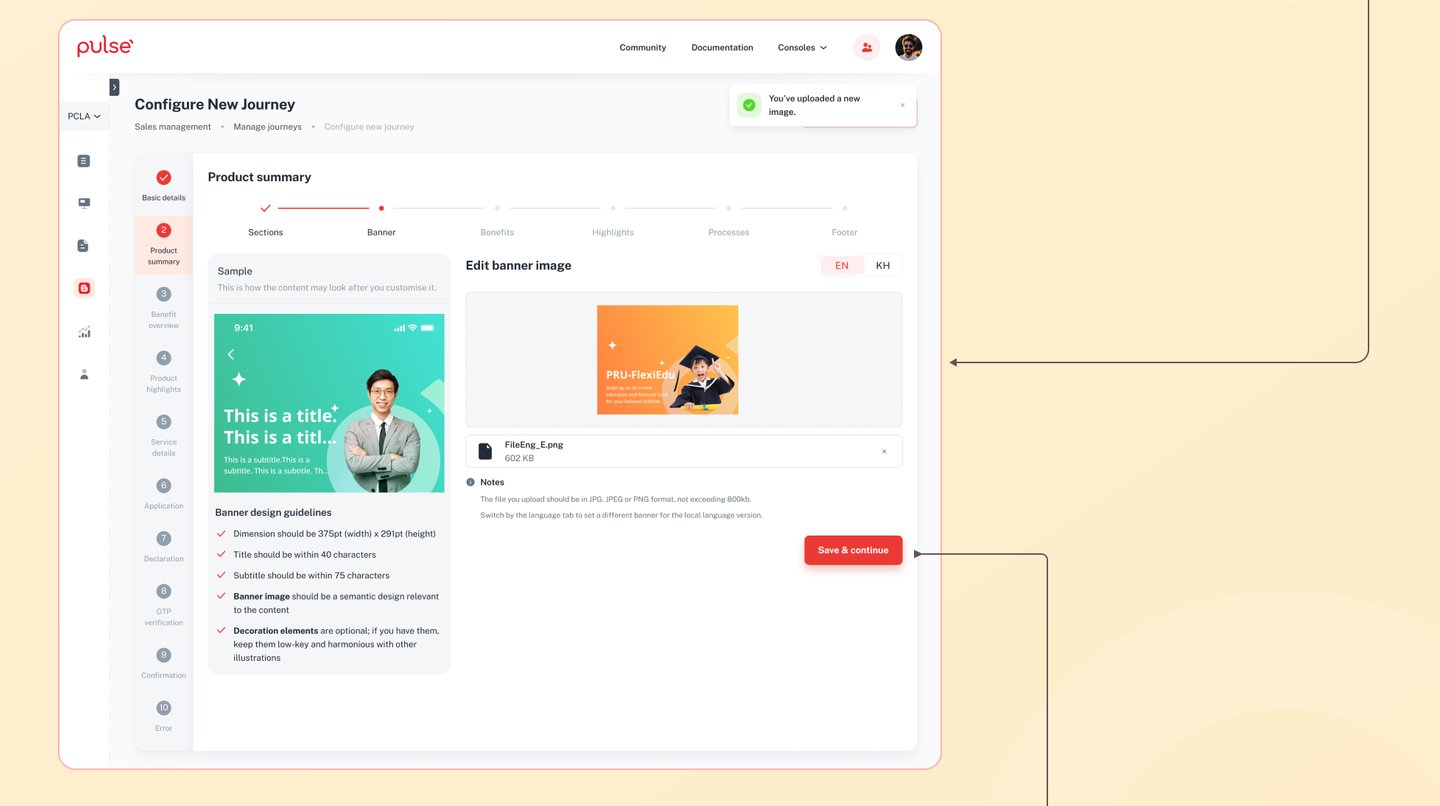
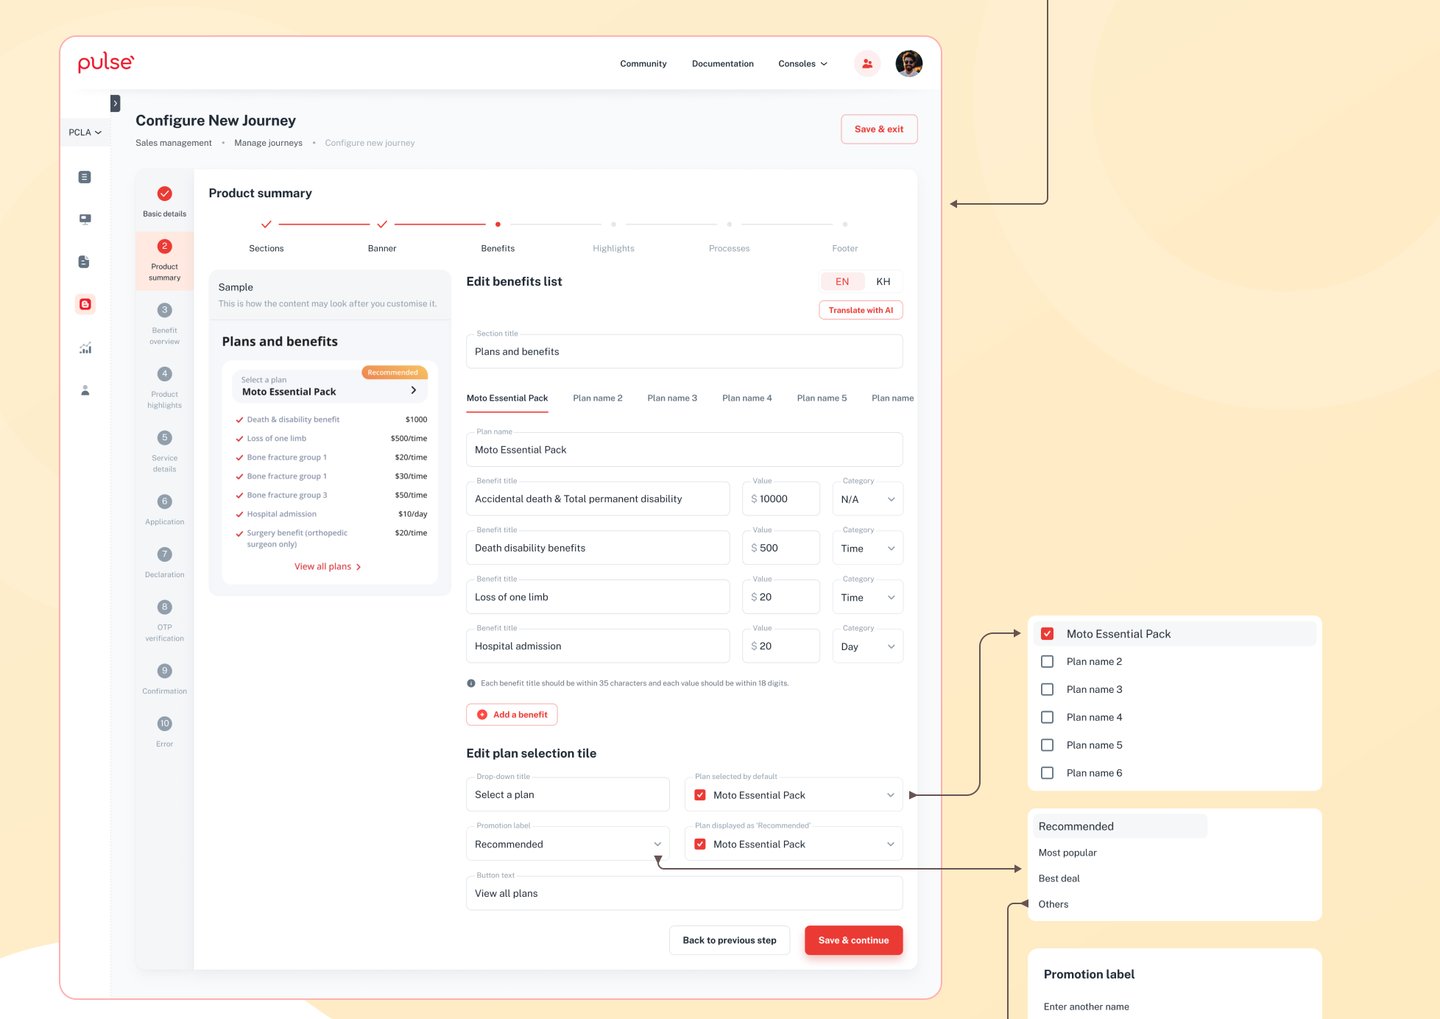
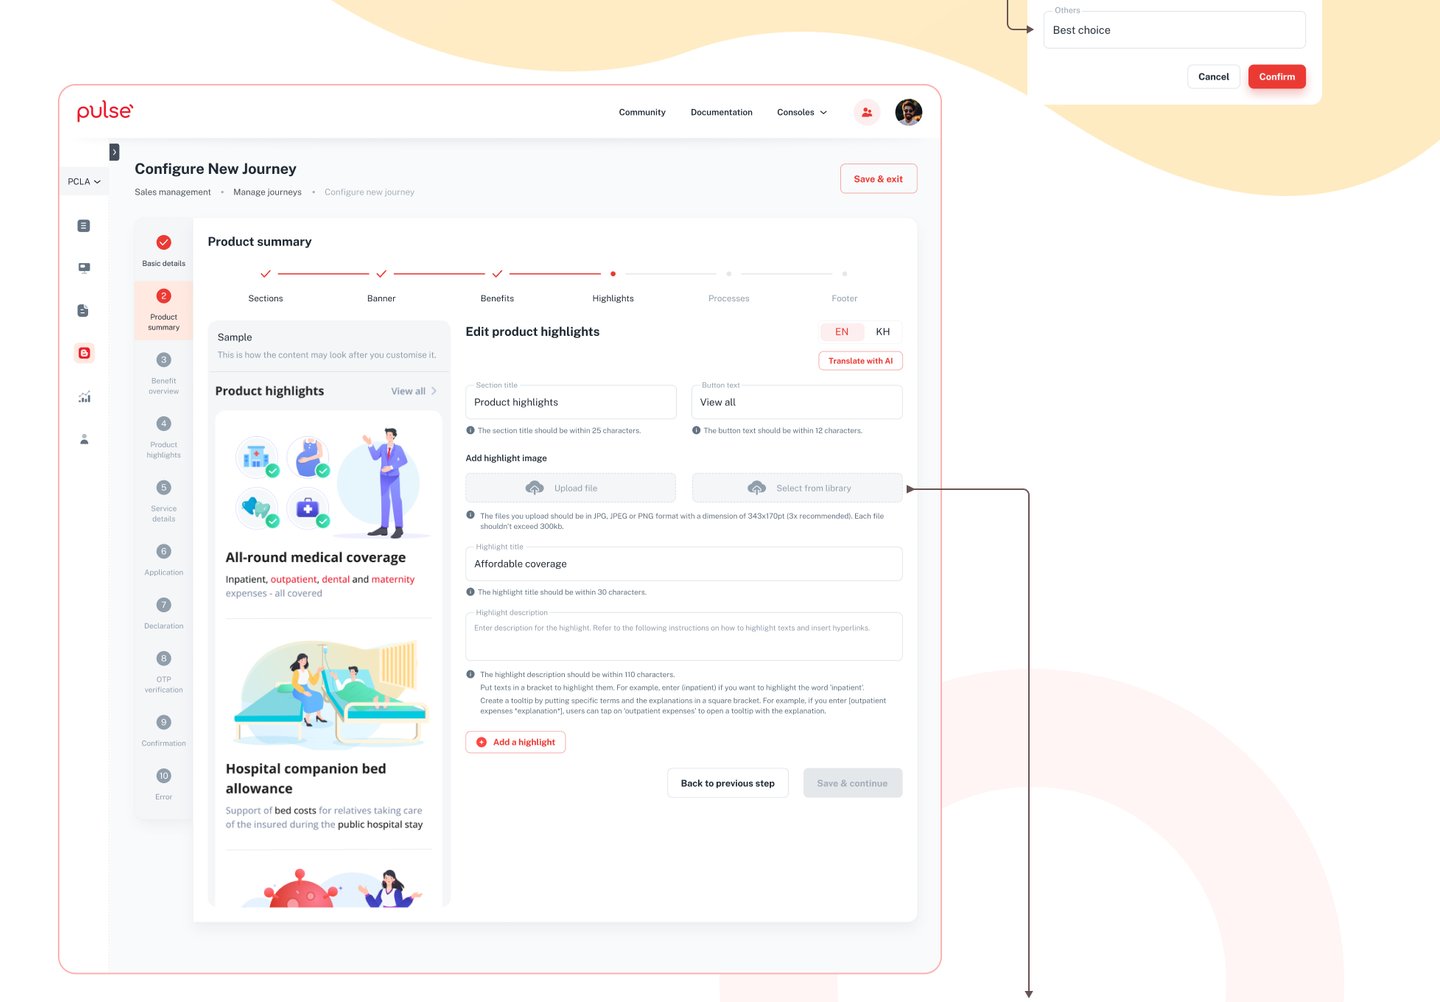
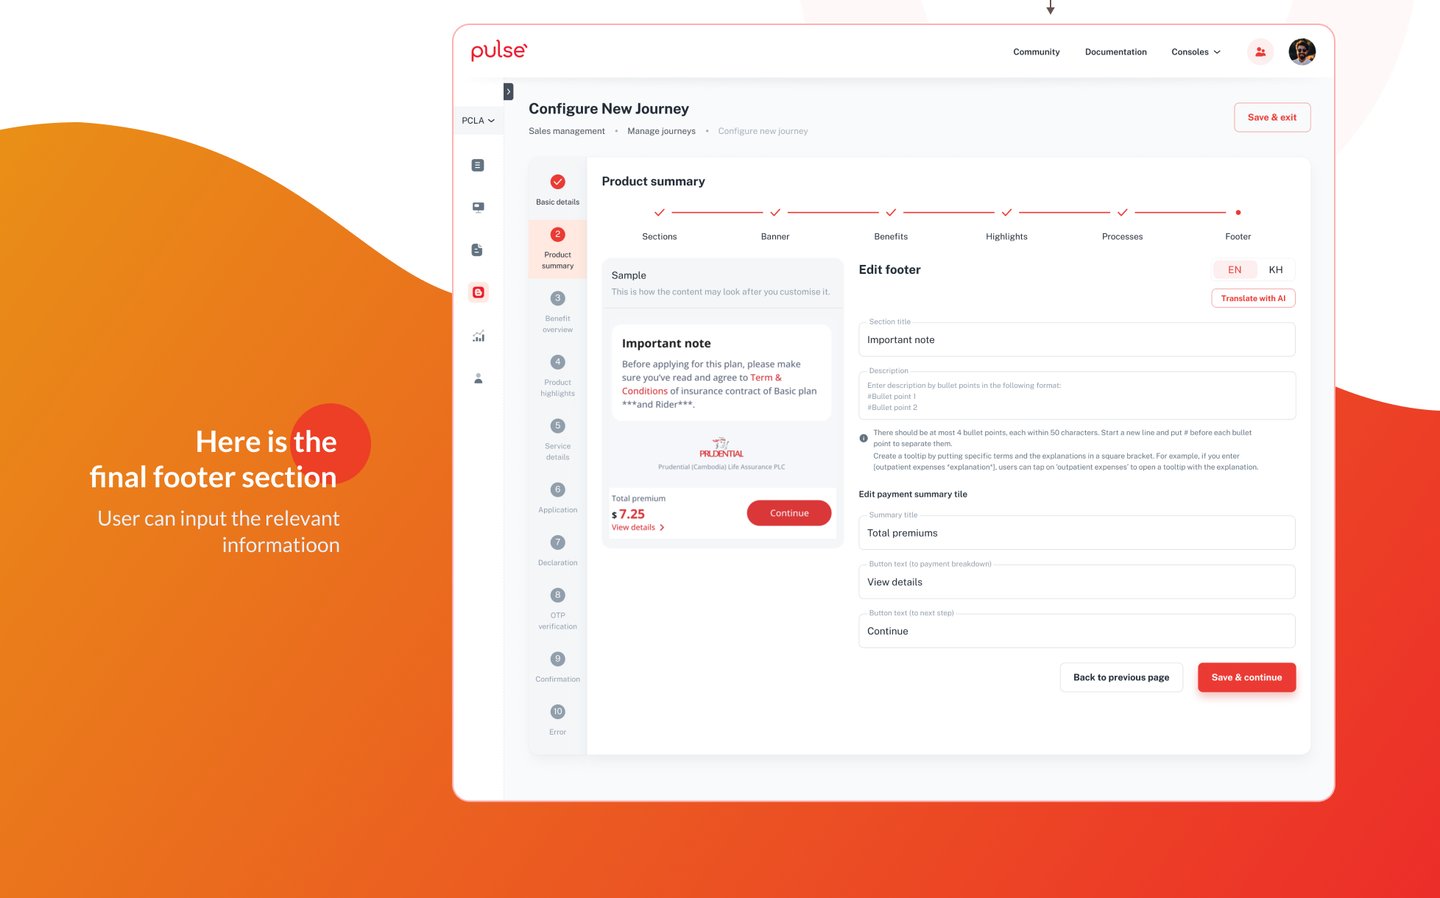
Prototype
A final UX prototype is a near-final version of a digital product or interface that is ready to be handed off to the development team. It is an interactive model that simulates the user experience and is used to validate the design concept before the final product is released.
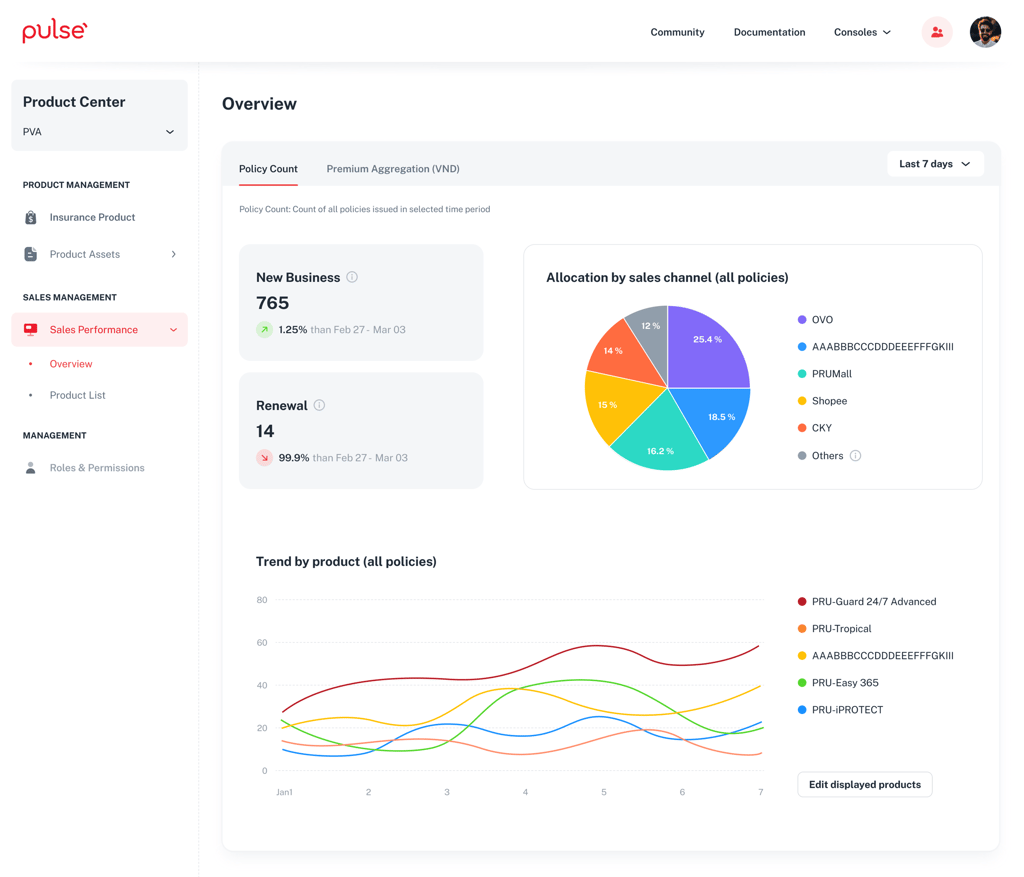
Sales Performance Dashboard
The Prudential Sales Performance Dashboard provides a centralized, data-driven solution for tracking and analyzing sales performance. By offering real-time insights, user conversion metrics, and distribution channel analysis, the dashboard empowers sales teams to make informed decisions, optimize strategies, and drive business growth. With its intuitive interface and actionable analytics, it enhances efficiency and ensures better alignment between sales goals and market demands.
Conclusion
Usability testing for Prudential Insurance Product Configuration provided valuable insights into user behavior, preferences, and pain points. By observing real users navigating the platform, we identified areas requiring improvement and validated design decisions.
Implementing the feedback from usability testing will ensure a more intuitive, user-friendly experience, empowering sales, marketing, and operations teams to manage insurance products efficiently. This iterative approach will contribute to higher user satisfaction, increased adoption, and improved business outcomes.
Continuous usability testing and refinement will further enhance the platform's effectiveness, supporting Prudential's goal of delivering a seamless and efficient insurance management experience.
Metrics to Measure Success
User Experience Metrics:
Task Completion Rate:
Input: Number of users completing product configuration tasks / Total number of users attempting tasks
Goal: >90% completion rateTime on Task:
Input: Total time taken for configuration tasks / Number of tasks completed
Goal: Reduce time by 30% within 6 monthsError Rate:
Input: Number of configuration errors / Total configuration attempts
Goal: <5% error rateUser Satisfaction (CSAT):
Input: Survey score from users (1-5 or 1-10) post-configuration
Goal: Achieve a CSAT score of 4.5 or above
Business Impact Metrics:
Time to Market:
Input: Average time from product configuration to launch
Goal: Reduce time to market by 40% within a yearSales Conversion Rate:
Input: Number of sales through configured product pages / Total visits to product pages
Goal: Increase conversion rate by 20%Product Launches:
Input: Number of products configured and launched per quarter
Goal: 10-15 product launches per quarterOperational Efficiency:
Input: Reduction in manual tasks reported by teams
Goal: Achieve 50% reduction in manual work
Adoption & Engagement Metrics:
Active User Rate:
Input: Number of active users per month / Total registered users
Goal: Maintain an 80% active user rateFeature Utilization:
Input: Frequency of feature use (e.g., banner upload, sales rule configuration)
Goal: Ensure 70% of users engage with core features weeklyTraining Completion:
Input: Number of users completing training / Total enrolled users
Goal: 90% training completion rate within the first 30 days
Performance Metrics:
System Uptime:
Input: Total uptime hours / Total operational hours
Goal: 99.9% uptimePage Load Time:
Input: Average time for a page to load (measured in seconds)
Goal: <2 seconds per pageIssue Resolution Time:
Input: Average time taken to resolve user-reported issues
Goal: Resolve 90% of issues within 24 hours